Building the Dashboard

How to:

In this procedure you will create a Flex project named SalesDashboard, import WebFOCUS Enable as a .swc file, and open the canvas on which you will create an application. After creating the canvas and importing the main data source, you will build panels to hold the lists used to drill down in your data source. Finally you will insert charts to display the information.


Top of page

x
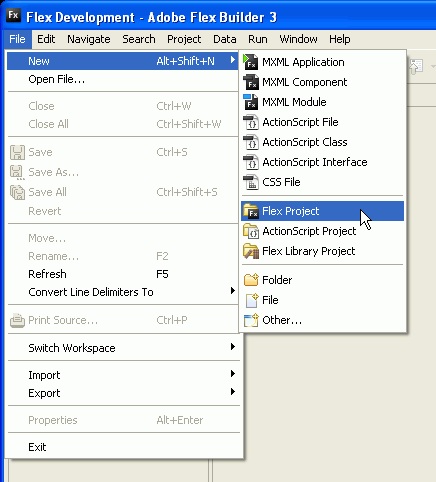
Procedure: How to Create the Flex Project
  1. From the Flex Development window, select File, New, and Flex Project, as shown in the following image.

    Flex Development window

  2. Name the project SalesDashboard and click Next.
  3. Use the default location for the Output Folder and click Next
  4. On the next dialog box, select the Library path tab and click Add SWC.

    Library path dialog box

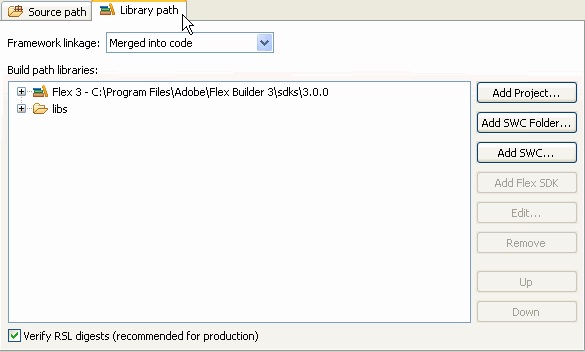
  5. Browse to the directory in which the WebFOCUS3Enable.SWC file is located, select it, and click OK.
  6. Click Finish.

Top of page

x
Procedure: How to Build the Dashboard Canvas
  1. Select the Design tab to switch to layout view, where you can drag and drop components onto the Flex Builder canvas.

    Design tab Flex Builder canvas

  2. In the Design Area drop-down, change Fit to window to 1024 x 768.

    Design Area drop-down list

  3. Expand the Custom folder in the Components Pane to display all of the Information Builders custom components.
  4. Drag and drop the ibiCanvas component onto the SalesDashboard.mxml canvas.
  5. Make sure the Flex Properties pane is visible by selecting Window then Flex Properties. Scroll down to the Layout section of the Flex Properties pane and, with the ibiCanvas component selected, set the following properties:
    • Width: 1024
    • Height: 650
    • X: 9
    • Y: 10

    Flex Properties pane


Top of page

x
Procedure: How to Add the Main ibiDataGrid to the Dashboard
  1. Drag and drop the ibiDataGrid component inside the ibiCanvas.
  2. With the ibiDataGrid component selected, change the following Flex Properties:
    • ID: MAIN01
    • Width: 550
    • Height: 110
  3. Select the Category View in the Flex Properties pane to change the pane view.

    Category View in the Flex Properties pane

  4. Expand the IBI Data tree and set the seturl property to the following:
    http://localhost:8080/ibi_apps/WFServlet?IBIF_ex=xmltest

    Note: The xmltest.fex that is being called must be created and added to the proper directory. For more information, see Creating an Input File in WebFOCUS Developer Studio.

  5. Click the Run button. If prompted, select OK to save and run the project.
  6. Close the page and return to the dashboard.
  7. With the ibiDataGrid component selected, set the visible property to false.

    visibility property in the Flex Properties pane


Top of page

x
Procedure: How to Add Panels to the Dashboard
  1. Expand the Layout components folder in the Components Pane.
  2. Drag and drop the Panel component onto the SalesDashboard.mxml canvas.
  3. With the Panel component selected, expand the Size tree in the Flex Properties pane, and set the following Flex Properties:
    • Width: 108
    • Height: 200
    • X: 10
    • Y: 43
  4. Insert another Panel by copying the panel you created in step 2 and pasting it onto the SalesDashboard.mxml canvas.
  5. With the Panel component selected, set the following Flex Properties:
    • X: 126
    • Y: 43
  6. Paste another Panel onto the canvas.
  7. With the Panel component selected, set the following Flex Properties:
    • Width: 555
    • Height: 200
    • X: 242
    • Y: 43
  8. Paste another Panel onto the canvas.
  9. With the Panel component selected, set the following Flex Properties:
    • Width: 390
    • Height: 300
    • X: 10
    • Y: 251
  10. Paste another Panel onto the canvas.
  11. With the Panel component selected, set the following Flex Properties:
    • Width: 390
    • Height: 300
    • X: 408
    • Y: 251
  12. Double-click the top portion of each Panel, inserting the appropriate titles as shown below.

    Panel component in SalesDashbaord canvas


Top of page

x
Procedure: How to Add ibiLists to the Dashboard
  1. Expand the Custom folder in the Components Pane and drag and drop the ibiList component inside the Select Region panel.
  2. Resize the ibiList so it fits within the panel.
  3. With the ibiList component selected, expand the Common, IBI Data, IBI Filter, and the IBI General trees in the Flex Properties pane, then set the following Flex Properties:
    • ID: list1
    • ibiParent: MAIN01
    • ibiFilterAble: true
    • ibiColumn: REGION

      Note: REGION is a field name. Field names are case-sensitive and they must be typed exactly as they appear in the master file.

    ibiList component trees in the Flex Properties pane

  4. Click the Run button. If prompted, select OK to save and run the project. The values for REGION are now displayed in the Select Region panel.

    Flex Builder output

  5. Close the page and return to the dashboard.
  6. Insert an ibiList component into the Select State panel by copying the list you created in steps 1 and 2 and pasting it into the Select State panel.

    Note: When you paste the ibiList component, make sure you insert the ibiList into the correct panel (in this case, the Select State panel).

  7. With the ibiList component selected, change the following Flex Properties:
    • ID: list2
    • ibiFilterParent: list1
    • ibiColumn: ST

    Note: Since this ibiList component is a copy of the ibiList you created in steps 1 and 2, the values for ibiParent and ibiFilterAble have already been entered and should remain the same.

  8. Click the Run button. If prompted, select OK to save and run the project. The values for ST are now displayed in the Select Sate panel. You can also narrow the states listed by selecting a region.

    Flex Builder output

  9. Close the page and return to the dashboard.

Top of page

x
Procedure: How to Add a Filtered ibiDataGrid
  1. Drag and drop the ibiDataGrid component inside the Regional Detail Transactions panel.
  2. Resize the ibiDataGrid so it fits within the panel.
  3. With the ibiDataGrid component selected, change the following Flex Properties:
    • ID: detail
    • ibiParent: MAIN01
    • ibiFilterAble: true
    • ibiUseColumns: REGION,ST,PRODUCT,DOLLARS,UNITS,COGS
    • ibiFilterParent: list2
  4. Select the Standard View in the Flex Properties pane to change the pane view.
  5. To make the DataGrid appear without scroll bars, scroll down to the Layout section of the Flex Properties pane and check all four corner restraints, as shown in the following image.

    Standard View in Flex Properties pane

  6. Click the Run button. If prompted, select OK to save and run the project. The ibiDataGrid can be filtered by selecting from the Select State and Select Region panels.

    Flex Builder output

  7. Close the page and return to the dashboard.

Top of page

x
Procedure: How to Add an ibiColumnChart and ibiPieChart to the Dashboard
  1. Drag and drop the ibiColumnChart component inside the Sales by State panel.
  2. Resize the ibiColumnChart so it fits within the panel.
  3. Select the Category View in the Flex Properties pane to change the pane view.
  4. With the ibiColumnChart component selected, expand the IBI Data, IBI General, and the Data trees in the Flex Properties pane, then set the following Flex Properties:
    • ibiGroupBy: ST
    • ibiParent: detail
    • ibiUseFiltered: true
    • ibiXfield: ST
    • ibiYfield: Sum.DOLLARS,Sum.UNITS,Sum.COGS
    • showDataTips: true

    ibiColumn chart component Category View

  5. Click the Run button. If prompted, select OK to save and run the project.

    Flex Builder output

  6. Close the page and return to the dashboard.
  7. Drag and drop the ibiPieChart component inside the Sales by Product panel.
  8. Resize the ibiPieChart so it fits within the panel.
  9. With the ibiPieChart component selected, set the following Flex Properties:
    • ibiGroupBy: PRODUCT
    • ibiParent: detail
    • ibiUseFiltered: true
    • ibifield: Sum.DOLLARS
    • ibiNameField: PRODUCT
    • showDataTips: true
  10. Click the Run button. If prompted, select OK to save and run the project.

    Flex Builder output

  11. Close the page and return to the dashboard.

WebFOCUS