Customizing IBI Chart Components
xSorting Data in IBI Chart Components
In all IBI chart components, you can use the ibiDefaultSort
and ibiDefaultSortOrder properties to change and apply different
sort orders to the chart.
|
Property
|
Description
|
|---|
|
ibiDefaultSort
|
Specify the column name to sort on.
|
|
ibiDefaultSortOrder
|
Specify the sort order to be either ascending
or descending. The values accepted are: ASCE or DESC.
|
Note: If you change the sort order during run time, these
values will be overwritten.
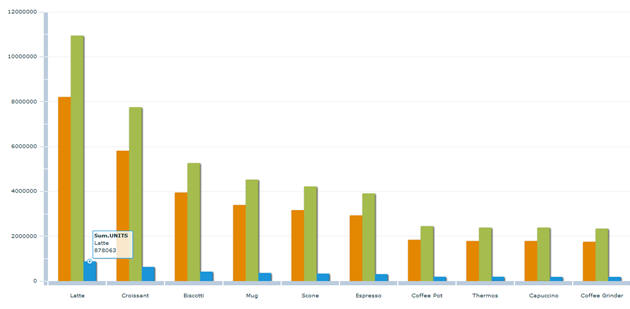
Example: Changing Sort Order in ibiColumnChart
The
following column chart will be sorted by the Sum.UNITS value in
descending order, from highest to the lowest, instead of the default
sort order based on the values in the GroupBy field.
<ibi:ibiColumnChart
     id="colchart1"
     ibiParent="chartsDP"
     ibiGroupBy="PRODUCT"
     ibiXField="PRODUCT"
     ibiYField=Sum.COGS,Sum.DOLLARS,Sum.UNITS"
     ibiDefaultSort="Sum.UNITS"
     ibiDefaultSortOrder="DESC"
     showDataTips="true" />
The following image
shows the resulting output.
xFlex Chart Property Support
The Information Builders Chart components support all
Flex Chart component properties. You can add more detailed styling
and animation effects while still utilizing the data aggregation,
calculation, and filtering options Enable components provide.
Due to the nature of XML in MXML source code, flex properties
that exist under the Adobe mx namespace prefix need to be nested
as children of the properties in the ibi namespace prefix, as shown
in the following example.
<ibi:verticalAxisRenderers>
  <mx:AxisRenderer id="l1" placement="left" axis="{v1}"/>
  <mx:AxisRenderer id="r1" placement="right" axis="{v2}"/>
</ibi:verticalAxisRenderers>
xibiPieChart: showDataEffect Support
You can use the Flex <mx:PieSeries> property nested
inside ibiPieChart to add showDataEffect properties to specify and
display effects in ibiPieChart. There are three effect classes for
the Flex charting components supported.
|
Effect
|
Description
|
|---|
|
SeriesInterpolate
|
Moves graphics that
represent the existing data in a series to the new points.
|
|
SeriesSlide
|
Slides a data series
into and out of the chart boundaries.
|
|
SeriesZoom
|
Implodes and explodes
chart data into and out of the focal point that you specify.
|
xibiLineChart: ibiLineStyle Support
In addition to using the Flex chart property to add
styles and effects, you can use the ibiLineStyle property to add
basic styles and effects to ibiLineChart.
There are three supported properties.
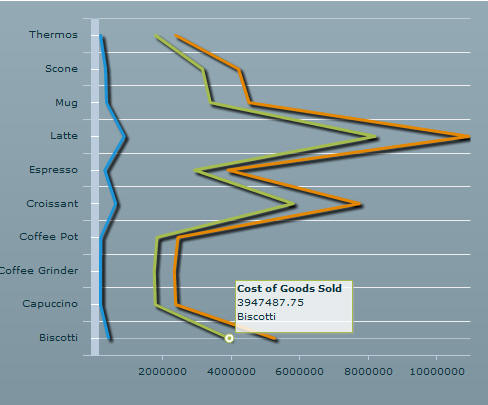
xibiLineChart: Using Vertical Lines
You can use ibiLineChart to display a vertical progression
of data by setting the sortOnXField property of the LineSeries object
to false.
Example: Using the ibiLineChart Property to Display Vertical Lines
The
following example creates a line chart with the lines displaying
vertically instead of the default display of horizontal lines.
<ibi:ibiLineChart id="myChart"
     ibiParent="childGrid"
     showDataTips="true"
     x="383" y="25"width="476" height="363" >
  <ibi:verticalAxis>
       <mx:CategoryAxis categoryField="PRODUCT" />
  </ibi:verticalAxis>
  <ibi:series>
      <mx:LineSeries
          xField="Sum.DOLLARS"
          yField="PRODUCT"
          displayName="Total Sales"
          sortOnXField="false" />
      <mx:LineSeries
          xField="Sum.COGS"
          yField="PRODUCT"
          displayName="Cost of Goods Sold"
          sortOnXField="false" />
      <mx:LineSeries
          xField="Sum.UNITS"
          yField="PRODUCT"
          displayName="Returns"
          sortOnXField="false" />
  </ibi:series>
</ibi:ibiLineChart>
The following image shows
the line chart created with vertical lines.