Understanding Additional Chart Types
x
ibiAreaChart is available in WebFOCUSEnable Charts folder.
Similar to other IBI charts, you can create a chart either against
the detailed data in the data grid and perform the aggregation dynamically
or against the summarized data in an already aggregated data grid.
You can also apply a filter dynamically to the chart from any IBI
filtering components. You can use the standard Adobe chart styling
and effect properties to style and animate the chart.
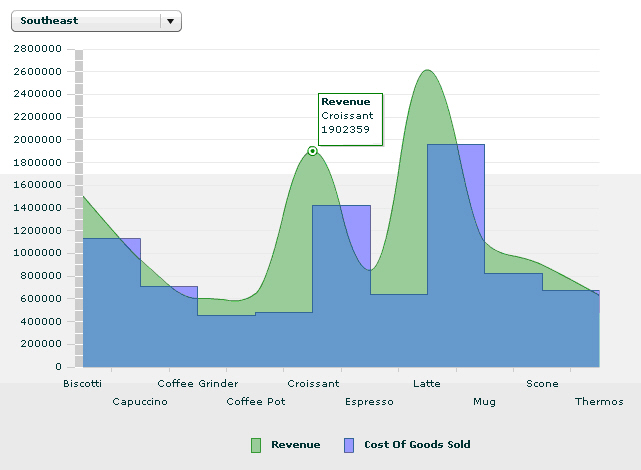
Example: Creating and Styling an ibiAreaChart
In
the following example, the data from the detailed data grid is aggregated
dynamically in an IBI area chart. Each AreaSeries is styled separately
using Adobe chart style properties and animated. For more details
on Adobe chart style properties, please refer to Adobe documentation.
<ibi:ibiAreaChart x="10" y="40" width="625" height="355"
     ibiGroupBy="PRODUCT"
     ibiParent="main01"
     id="area1"
     ibiUseFiltered="true"
     showDataTips="true">
  <ibi:horizontalAxis>
     <mx:CategoryAxis categoryField="PRODUCT"/>
  </ibi:horizontalAxis>
  <ibi:series>
    <mx:AreaSeries
         form="curve"
         displayName="Revenue"
         showDataEffect="int"
         yField="Sum.DOLLARS">
       <mx:areaStroke>
          <mx:Stroke color="#14811B" weight="1" alpha="0.8"/>
       </mx:areaStroke>
<mx:areaFill>
<mx:SolidColor color="green" alpha="0.4"/>
</mx:areaFill>
</mx:AreaSeries>
<mx:AreaSeries
form="step"
displayName="Cost Of Goods Sold"
showDataEffect="int"
yField="Sum.COGS">
<mx:areaStroke>
<mx:Stroke color="#304D8B" weight="1" alpha="0.8"/>
</mx:areaStroke>
<mx:areaFill>
<mx:SolidColor color="blue" alpha="0.3"/>
</mx:areaFill>
</mx:AreaSeries>
</ibi:series>
</ibi:ibiAreaChart>The code will result in
an area chart, as follows.
x
ibiGauge is available in WebFOCUSEnable Charts folder.
Similar to other IBI charts, you can create a gauge either against
the detailed data in the data grid and perform the aggregation dynamically
or against the summarized data in already aggregated data grid.
You can also apply filter dynamically to the gauge from any of IBI
filtering components. The range of values for data visualization
background color currently does not change dynamically, so the initial
range set will be used in the gauge even when the filter is applied.
Note: ibiGauge is not supported in SDK 4.x.
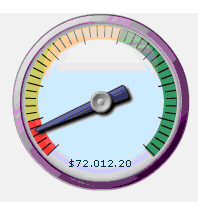
Example: Aggregating Data Dynamically in an ibiGauge
In
the following example, the data from the detailed data grid is aggregated
dynamically in the gauge, the indicator is set to point to the average
profit value of New England region, and the data visualization background
color is applied. Red color is used to indicate the average profit
values from 0 to 100K, then yellow from 100K to 500K, and green
from 500K to 900K in the background. The value displayed in the
label on the gauge is formatted using CurrencyFormatter.
<ibi:ibiGauge x="439" y="202" width="193" height="176"
  id="gauge01"
  ibiParent="main01"
  ibiGroupBy="REGION"
  ibiUseColumns=" REGION,Average.PROFIT,Min.PROFIT,Max.PROFIT"
  ibiFilterDefault="REGION EQ New England"
  ibiMinValue="Min.PROFIT"
  ibiMaxValue="Max.PROFIT"
  ibiValue="Average.PROFIT"
  ibiAlertAlphas=".7,.7,.7"
  ibiAlertColors="red,yellow,green"
  ibiAlertValues="0,100000,500000,900000"
  ibiUseFiltered="true"
  ibiTickColor="#000000"
  ibiFaceColor="#dce2fc"
  ibiRimColor="purple"
  indicatorColor="#6467AA"
  labelFormatter="{cur}"/>
The code results in
the following output.
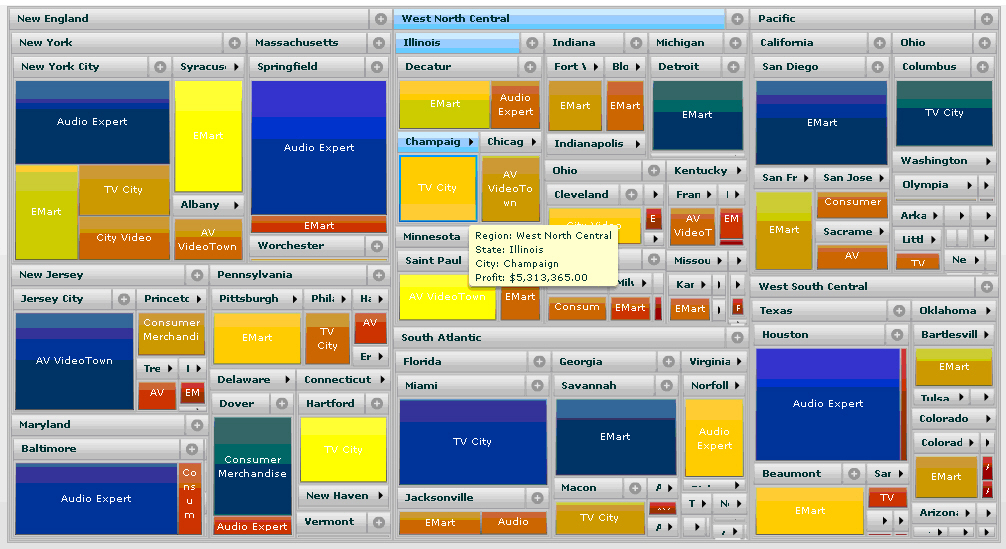
xUsing the ibiTreeMap Component
ibiTreeMap is available in the WebFOCUSEnable Charts
folder. ibiTreeMap displays the data as a set of nested rectangles
grouped into many parent categories. Each group can be expanded
or collapsed using plus and minus icons displayed in the category title
bar. The size of the rectangle is proportional to the aggregated
value of the specified column. You can set the color of the rectangles
to apply conditional color visualization to data values.
Similar to other IBI charts, you can create a chart either against
the detailed data in the data grid and perform the aggregation dynamically
or against the summarized data in already aggregated data grid.
You can also apply filter dynamically to the chart from any of IBI
filtering components.
Example: Using the ibiTreeMap Component
<ibi:ibiTreeMap x="10" y="211" width="994" height="537"
 id="treemap01"
 ibiParent="main01"
 ibiGroupBy="REGION,STATE,CITY,STORENAME"
 ibiTreeLabelField="REGION,STATE,CITY,STORENAME"
 ibiWeightField="Sum.PROFIT"
 ibiColorMedian="6500000"
 ibiCustomColors="#0119ae,green,yellow,#a30101"
 ibiUseFiltered="true"
 ibiLayoutStrategy="Squarify"
 dataTipFunction="treeDataTip"/>
The default data
tip is replaced to display field names using correct cases and the
Profit value is formatted using NumberFormatter in the custom data
tip function. The data tip function can reference all available
fields using item.allFields object.
private function treeDataTip(item:Object):String
{
  if(item.hasOwnProperty("weight")){
     return "Region: " + item.allFields.REGION + "\n" +
     "State: " + item.allFields.STATE + "\n" +
     "City: " + item.allFields.CITY + "\n" +
     "Profit: $" + num.format(item.weight.toString());
  }
  return "";
}
The result is shown in the following image.
xibiChartDataView Component
The ibiChartDataView component is a chart layout control
with paging animation that provides the data used in IBI Chart.
The component only works with IBI charts. You can only include one
chart in ibiChartDataView. When the page is peeled away using a
mouse click, it displays the data grid with the data used in the
chart. ibiChartDataView requires ibiChart child tags to wrap IBI
Charts around.
Note: ibiChartDataView is not supported in SDK 4.x.
Example: Using the ibiChartDataView Component
<ibi:ibiChartDataView x="10" y="61" width="390" height="170" activeGrabArea="page" borderColor="#15208C">
  <ibi:ibiChart>
    <ibi:ibiColumnChart id="col01"
      ibiParent="main01" ibiGroupBy="ST" ibiUseFiltered="true"
      ibiXField="ST" ibiYField="Sum.DOLLARS,Sum.COGS"/>
  </ibi:ibiChart>
</ibi:ibiChartDataView>