Procedure: How to Add a Tree Control
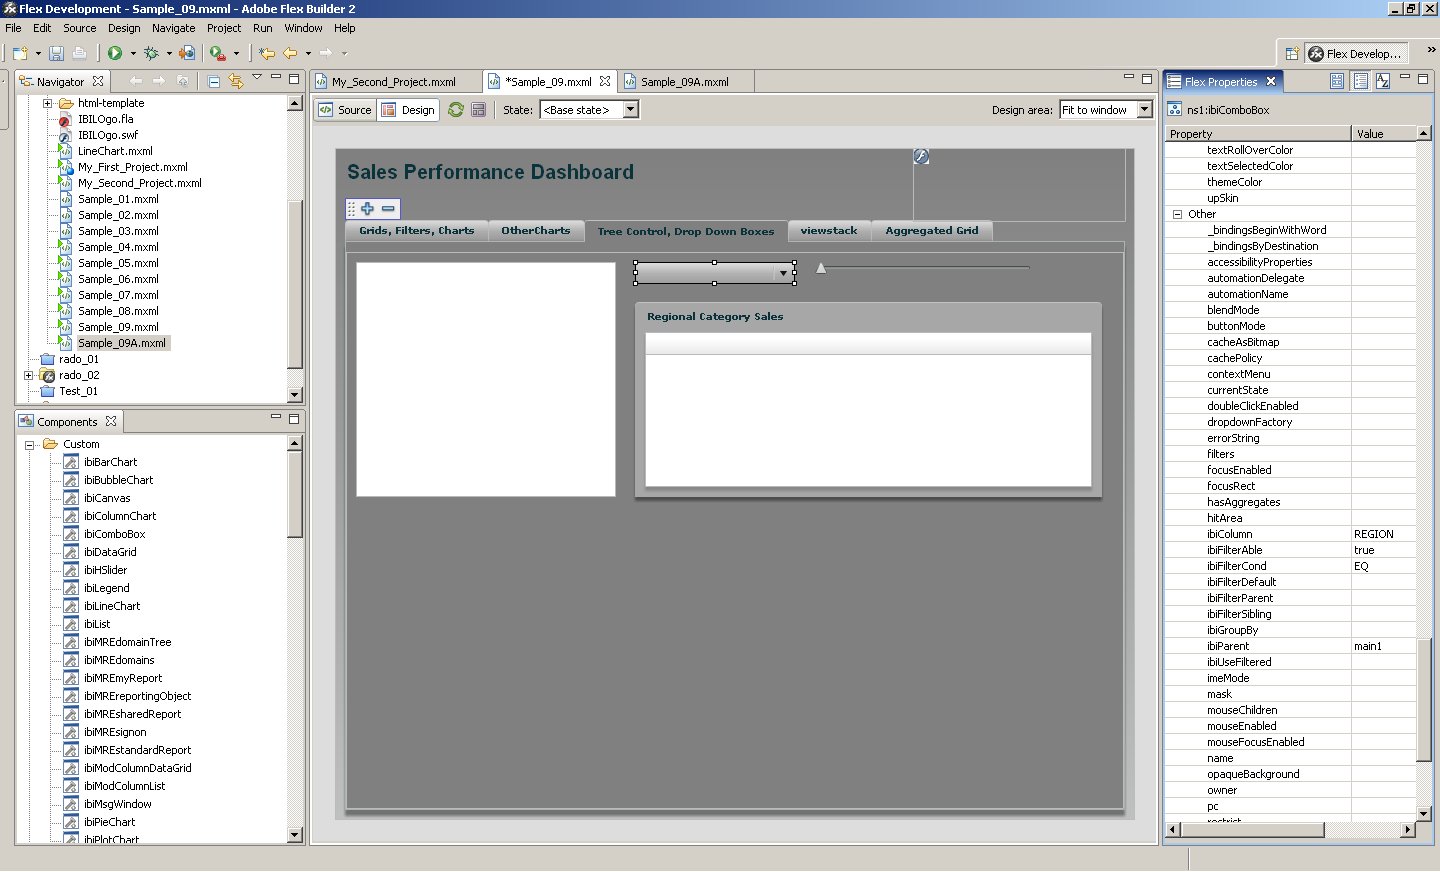
- Select the Tree Control, Drop Down Boxes tab.
- Drag and drop the ibiTree component onto the tab canvas and position it in the top-left corner.
-
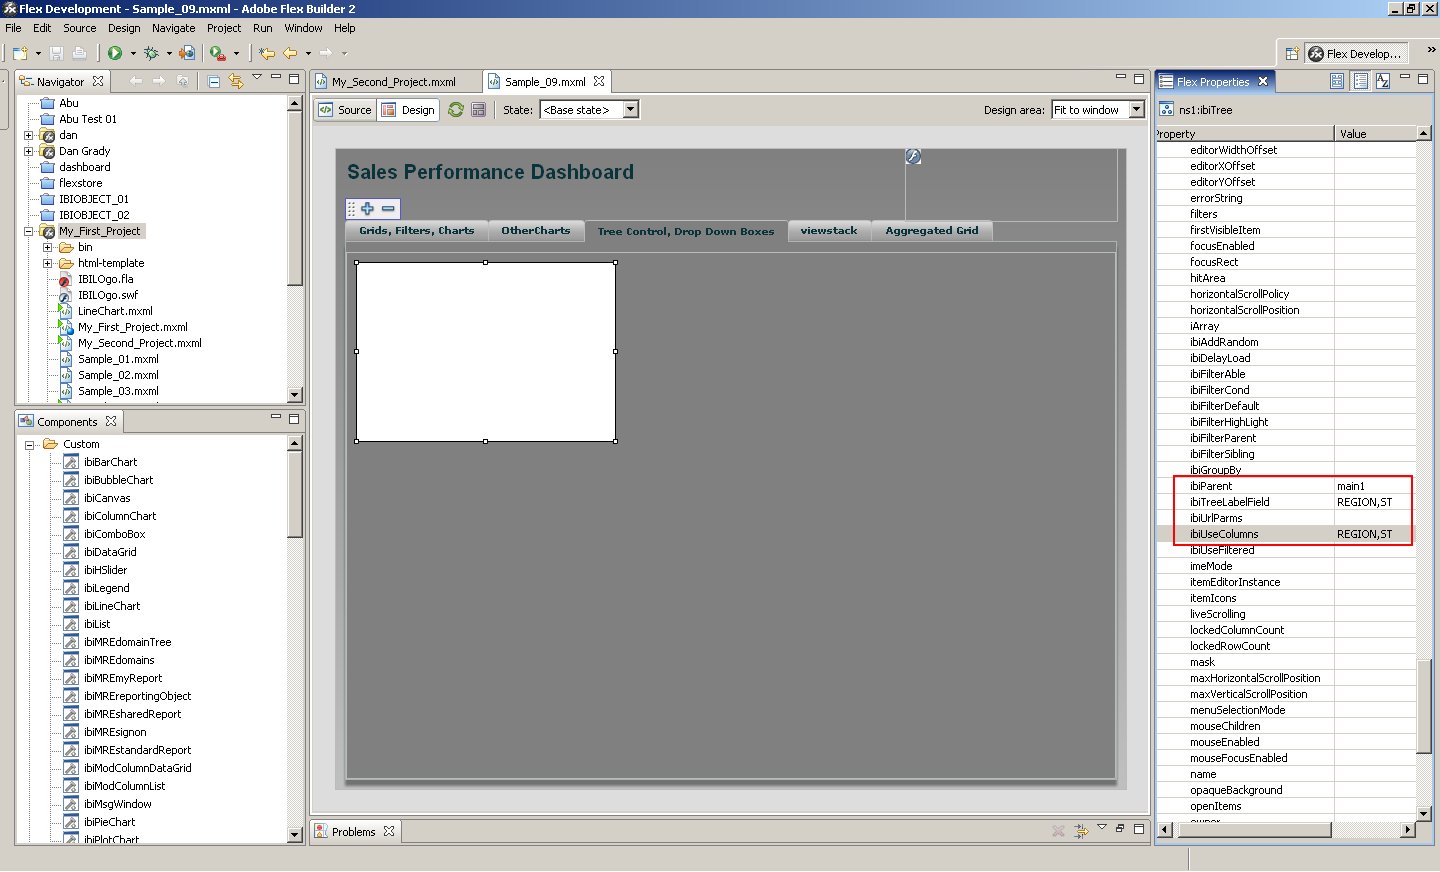
Set the
following properties:
- id=subtree
- Width=260
- Height=180
Tip: You can set the width and height by dragging the sides of the component.
- ibiParent=MAIN01
- ibiUseColumns=REGION,ST
- ibiTreeLabelField=REGION,ST. This property sets the labels for each node of the tree.
- ibiFilterAble=true
-
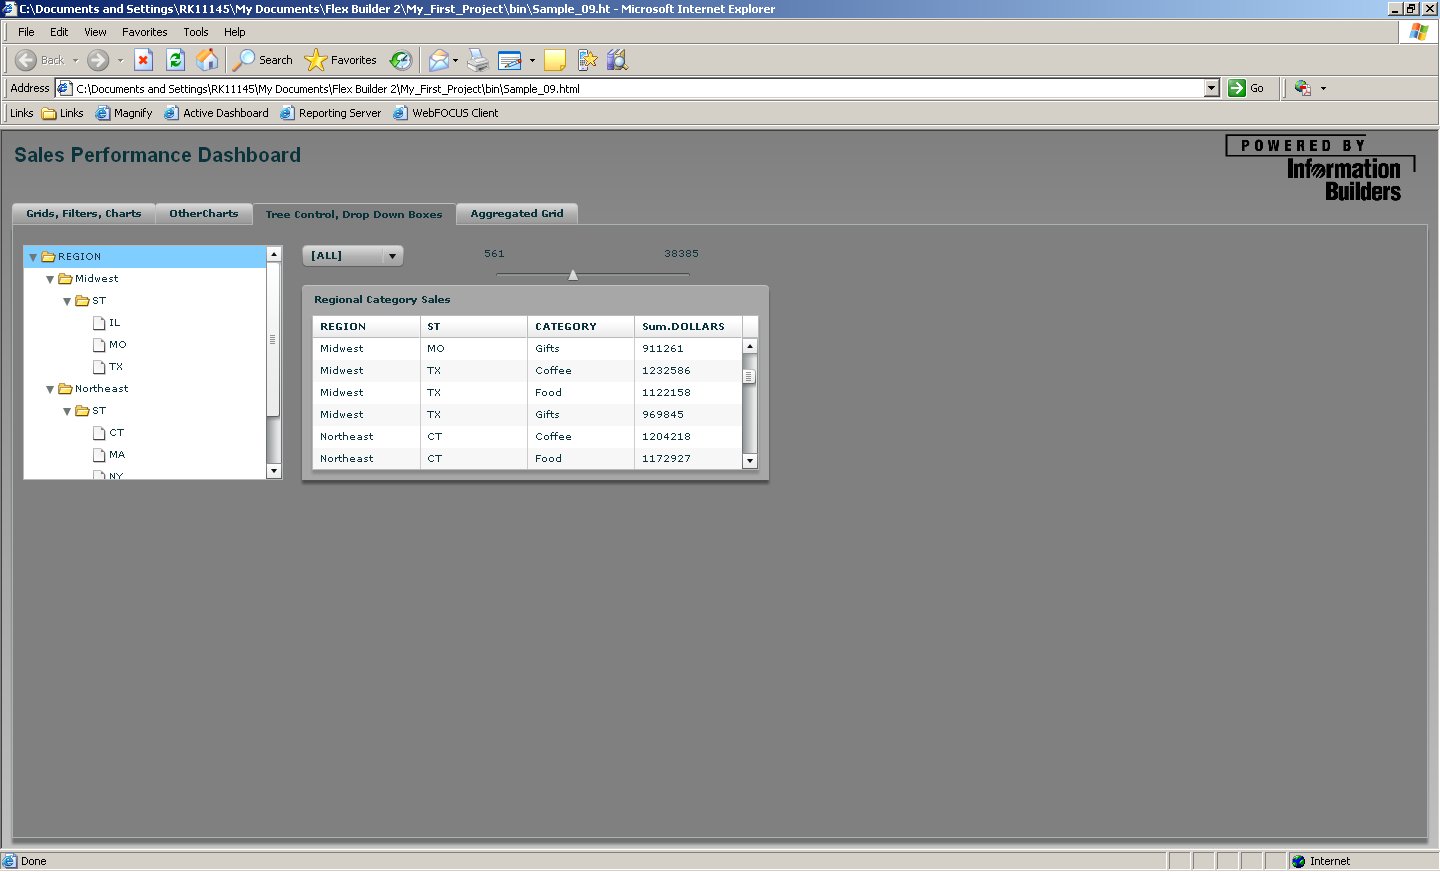
Run the
application.