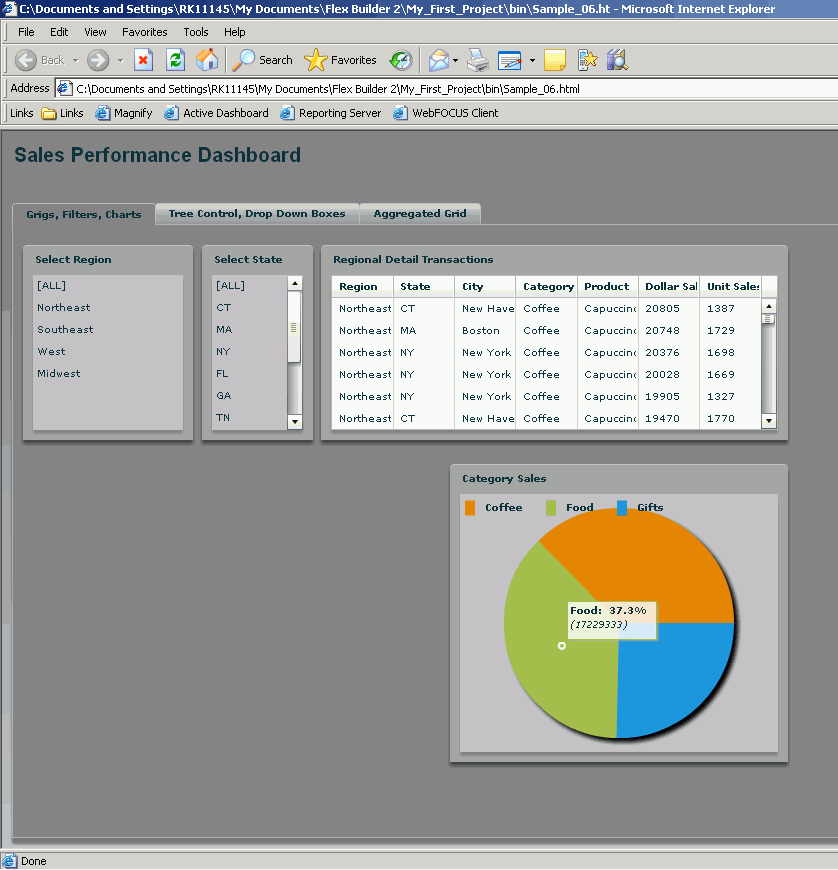
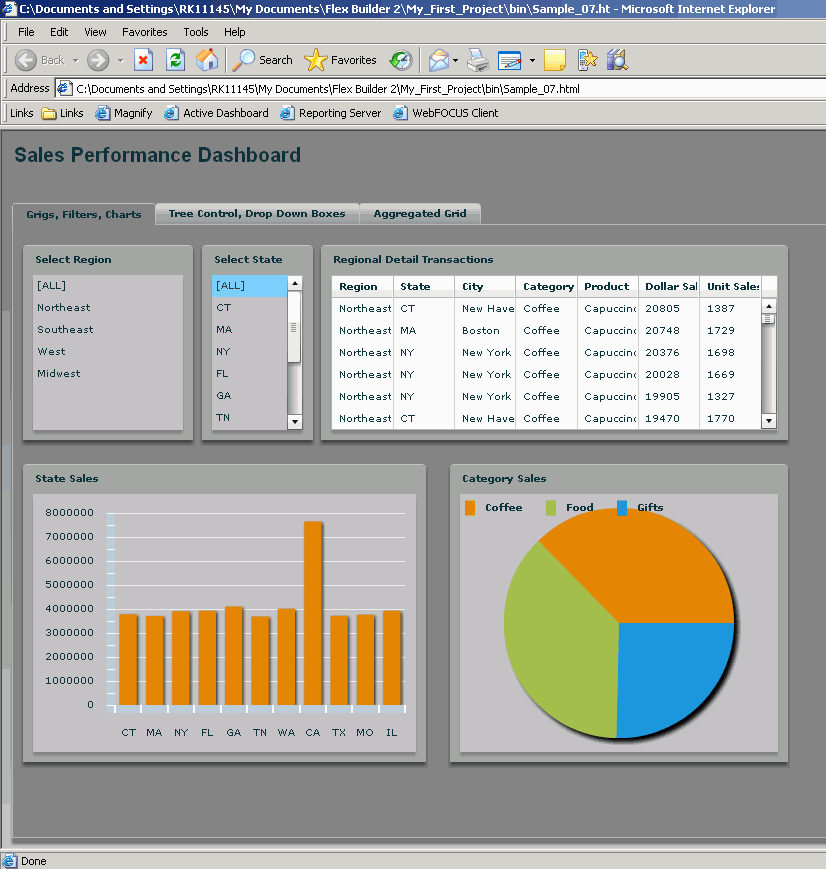
- Create another panel to host the ibiPieChart.
- Set the panel background color to #c0c0c0 to match the other panels.
- Set the title of the panel to Category Sales.
- Drag the ibiPieChart component onto the panel and adjust its size as described in previous topics.
-
Set the
properties as follows:
- id=SUBPIE01
- ibiField=Sum.DOLLARS
- ibiNameField=CATEGORY
- ibiGroupBy=CATEGORY
- ibiParent=MAIN01
- ibiUseFiltered=true. The nested filters will also be applied to the pie chart.
- showDataTips=true. This is a Flex Builder property that displays the data tips on mouse-over, showing the values for the pie slices and their percentage of the total. Like many other Flex Builder properties, this one is optional.
-
To create a legend for the chart, select the first tab.
Tip: Since the ibiLegend is a separate component, you must use a panel or canvas to host it within the dimension of the chart. Otherwise, it will be positioned at the side, bottom, or top of the chart. In general, to overlay components, you need a canvas.
- Drag and drop the ibiLegend component onto the panel containing the pie chart.
- Set ibiParent of the legend to SUBPIE01.
-
Run the
application.

