Creating the OLAP Report With the CENTORD Data Source
Now you will create a report with the Report Painter
and use the CENTORD data source. You do not need to create a hierarchy
when you create this report, because the sample CENTORD data source
already contains dimensions. After you OLAP-enable and run your
report, you will drill down on dimensions and measures, drag and
drop them, and use the right-click menu on the OLAP user interface.
x
Procedure: How to Create the OLAP Report With the CENTORD Data Source
-
If it
is not already open, expand the OLAP project folder.
-
Click
the Procedures folder.
-
Right-click
the Procedures folder and select New then
select Procedure.
The Add Procedure dialog box opens.
-
Name
the procedure CENTREP and choose Report Painter from the Create
with drop-down list.
-
Click Open.
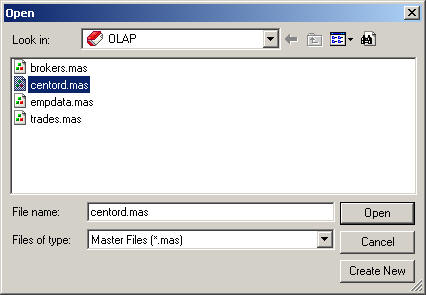
The Open dialog box asks you to specify the data source
you will use to create your hierarchy.
-
Select CENTORD.MAS.
-
Click Open.
The Report Painter opens, where you will create a report
using fields from the CENTORD data source.
x
Procedure: How to Add Fields From the CENTORD Data Source to the Report
To
create a report, you must add fields to it. Follow these steps to
add fields to your report in the Report Painter.
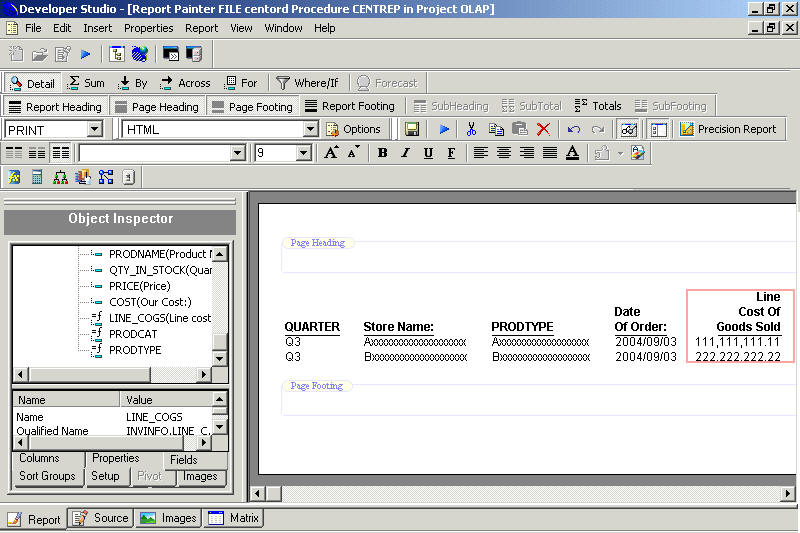
The Object Inspector window, located
at the left side of the Report Painter, lists the fields in the
CENTORD Master File.
-
Double-click
the following fields in the Fields tab on the Object Inspector to
add them to the report:
- QUARTER
- STORENAME
- PRODTYPE
- ORDER_DATE
- LINE_COGS
-
Select
the Quarter column and press the Shift key
and click the Store Name column to select
them simultaneously.
-
Click
the By
 button
on the main toolbar to sort the data for the Quarter and Store
Name columns vertically.
button
on the main toolbar to sort the data for the Quarter and Store
Name columns vertically.
-
Click
the PRODTYPE column.
-
Click
the Sum
 button.
-
Place
the cursor in the Page Heading area.
Tip: If your report boundaries are not showing (the
Page Heading and Page Footing areas), click the Report menu and
select View. Click the check box for Boundaries
in the General section and then click OK.
-
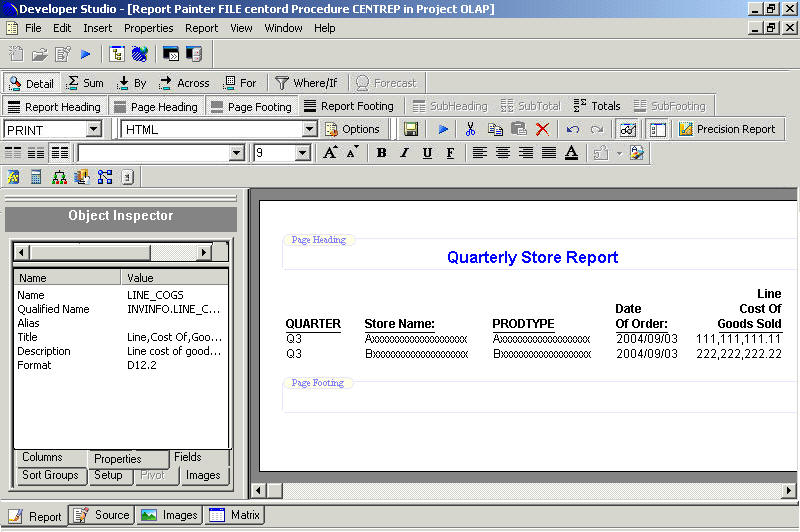
In the
Page Heading area, type Quarterly Store Report.
-
Press
the Enter key to add a blank line to the heading.
-
Highlight
the first line of heading text and select Fonts from
the Properties menu.
The following font attributes are the default:
- Font: Arial
- Font Style:
Bold
- Size: 10
-
Click
the Color button and select blue.
-
Click OK to
close the Font dialog box.
-
Click
the Center Justify
 button
on the toolbar.
button
on the toolbar.
Your report should now look like the following image.
x
Procedure: How to OLAP-enable and Run the CENTREP Report
You can OLAP-enable reports so that
users can benefit from Online Analytical Processing (OLAP) to quickly
change the presentation of data.
Complete the following steps
to OLAP-enable your report.
-
From
the Report menu, select Features. The Report
Options dialog box opens at the Features tab.
-
In the
OLAP area, select Top Panel from the Enable
OLAP drop-down list. When you later run your report, the OLAP selections
panel will appear above your report output.
-
Select Dimensions
and Measures from the Automatic Drill Down list. When
you later run your report, this will enable automatic drill-downs
on dimensions and measures.

-
Click OK.
-
Click Run.
Notice
that the OLAP selections panel opens above the report output, as
you requested in step 2. Use this panel to manipulate your output.
Also, notice that drill-down hyperlinks are active for the dimensions
and for measures.