Creating the OLAP Report With a Procedural Hierarchy
Now you will create a report with the Report Painter
and use the TRADES data source. You will use the dimensions you
created earlier with the Dimensions Tool. After you OLAP-enable
and run your report, you will drill down on dimensions and measures,
drag and drop them, and use the new right-click menu on the enhanced
OLAP user interface.
x
Procedure: How to Create the OLAP Report With a Procedural Hierarchy
-
If it
is not already open, open the Procedure Viewer for the TRADESREP
procedure.
-
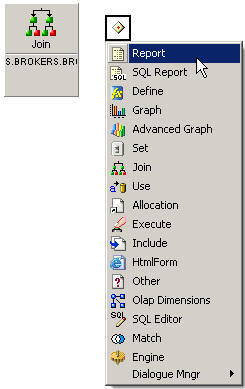
In the
Procedure Viewer, click the diamond to the right of the Join component
and select Report from the component connector toolbar.
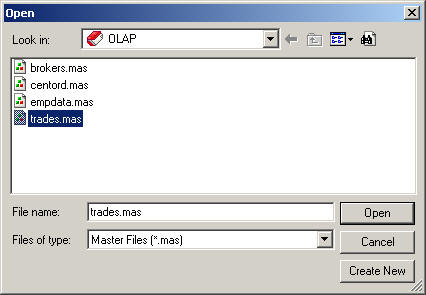
The Open dialog box asks you
to specify the data source you will be using to create your report.
-
Select TRADES.MAS.
-
Click Open.
The Report Painter opens, where you will create a report using fields
from the TRADES data source.
x
Procedure: How to Add Fields From the TRADES Data Source to the Report
To
create a report, you must add fields to it. Follow these steps to
add fields to your report in the Report Painter.
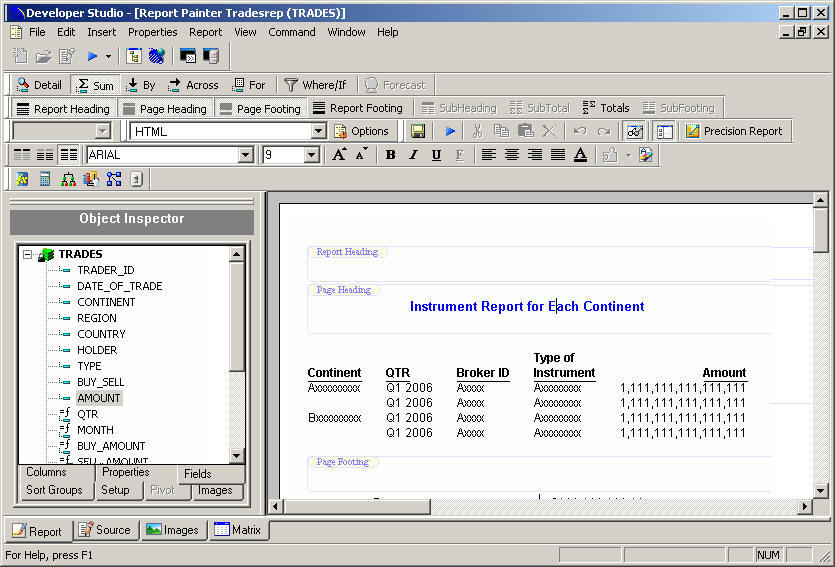
The Object Inspector
window, located at the left side of the Report Painter, lists the fields
in the TRADES Master File.
-
Double-click
the following fields in the Fields tab on the Object Inspector to
add them to the report:
- CONTINENT
- QTR
- TRADER_ID
- TYPE
- AMOUNT
-
Select
the Continent column and press the Shift
key and click the QTR column to select them simultaneously.
-
Click
the By
 button
on the main toolbar to sort the data for the Continent and QTR columns
vertically.
button
on the main toolbar to sort the data for the Continent and QTR columns
vertically.
-
Click
the Broker_ID column.
-
Click
the Sum
 button.
-
Place
the cursor in the Page Heading area.
-
In the
Page Heading area, type Instrument Report for Each Continent.
Tip: If your report boundaries are not showing (the
Page Heading and Page Footing areas), click the Report menu and
select View. Click the check box for Boundaries
in the General section and then click OK.
-
Press
the Enter key to add a blank line to the heading.
-
Highlight
the first line of heading text and select Fonts from
the Properties menu.
The following font attributes are the default:
- Font: Arial
- Font Style:
Bold
- Size: 10
-
Click
the Color button and select blue.
-
Click OK to
close the Font dialog box.
-
Click
the Center Justify
 button
on the toolbar.
button
on the toolbar.
Your report should now look like the following image.
x
Procedure: How to Run the TRADESREP Report
OLAP
options are available on the Report Painters Report Options Features
tab. The relevant options are Enable OLAP and Automatic
Drill Down.
You
can also enable OLAP from the OLAP option
on the Report menu. For details, see the Creating Reporting Applications With Developer Studio manual.
Complete the following
steps to OLAP-enable your report.
-
From
the Report menu, select Features. The Report
Options dialog box opens at the Features tab.
-
In the
OLAP area, select Top Panel from the Enable
OLAP drop-down list. When you later run your report, the OLAP selections
panel will appear above your report output.
-
Select Dimensions
and Measures from the Automatic Drill Down list. When
you later run your report, this will enable automatic drill downs
on dimensions and measures.

-
Click OK to
close the Report Options dialog box.
-
Click
the Run button.
Notice
that the OLAP selections panel appears above the report output,
as you requested in step 2. Use this panel to manipulate your output.
Also, notice that drill down hyperlinks are active for the dimensions
and measures.
x
Procedure: How to Manipulate Output With the Dimension Controls
In
an OLAP-enabled report, every dimension in the hierarchy has a control
(drop-down list) next to it. You can create selection criteria using
the dimension controls. You can also drag dimensions from the selections
panel (above the blue colored band) to the body of the report.
-
In the
OLAP selections panel, click the Continent down
arrow and double-click AMERICAS.
-
Click
the Run button.
-
Now
click the Month dimension control (the L-shaped line to the left
of MONTH) and drag it to the right of the QTR column
in the body of the report.
Note: You may also use the OLAP Control Panel window
to select Month and add it as a Drill Down field. Click Run from
the OLAP Control Panel.
Right-click
the QTR dimension in the report and select Move
to Across from the menu.
The
QTR column changes from a BY field to an ACROSS field.
Now
you have experimented with data manipulation in a report created
with a procedural hierarchy.
You can continue to the next
exercise, where you will use another data source and explore other
ways of manipulating data in an OLAP-enabled report.