In this section: How to: |
WebFOCUS Online Analytical Processing (OLAP) enables you to view and quickly analyze data in order to make critical business decisions. You can drill down or roll up data hierarchies, pivot fields from columns to rows (or rows to columns), and slice-and-dice information by filtering or querying data sources based on specified criteria or thresholds.
In the first exercise of this tutorial, you will create a project called OLAP. Use the Dimensions Tool to create the OLAP dimensions hierarchy, and create a report using the Report Painter. Then you can OLAP-enable the report so that you can manipulate data for quick comparison and analysis.
For more information about OLAP, see the Creating Reporting Applications With Developer Studio manual.
In this exercise, you will:
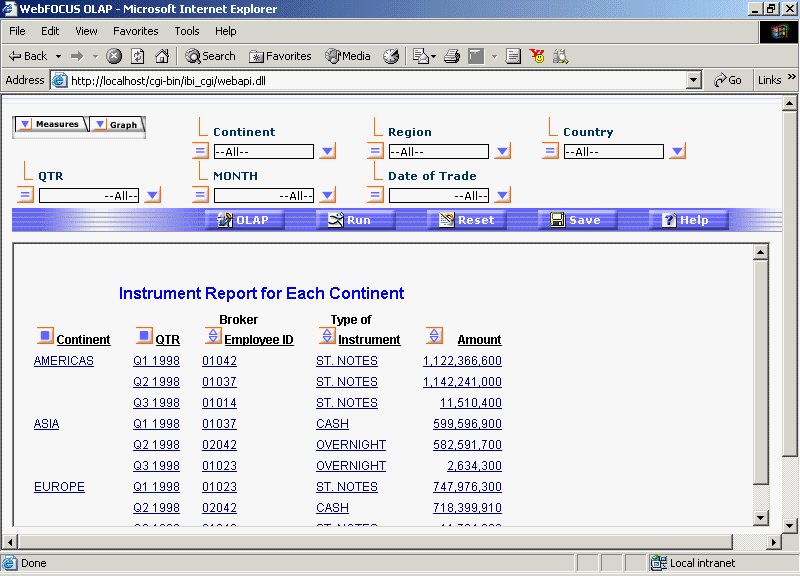
The following is an example of report output that is generated after you OLAP-enable and run a report.

Before you can do any development work in WebFOCUS Developer Studio, you must create a project. You can accomplish this by using the Project Wizard, which guides you through the project creation process by prompting you for all necessary information.
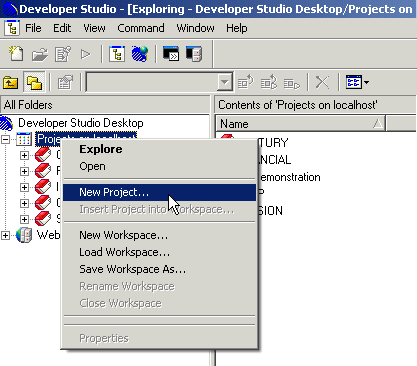
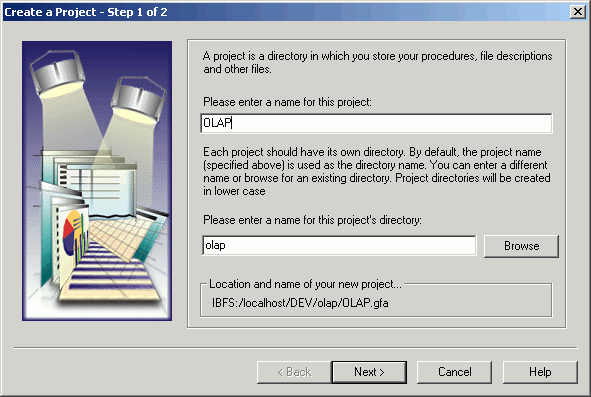
The Create a Project wizard opens at Step 1.
Note: Project directories are created in lowercase.
Directory OLAP does not exist. Do you want to create it?
Click Yes to confirm the creation of the physical directory for the new project.
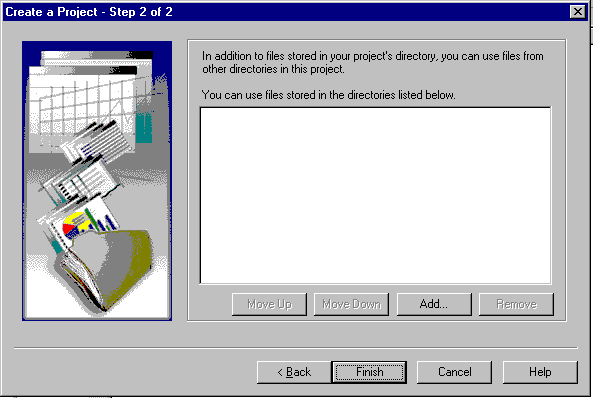
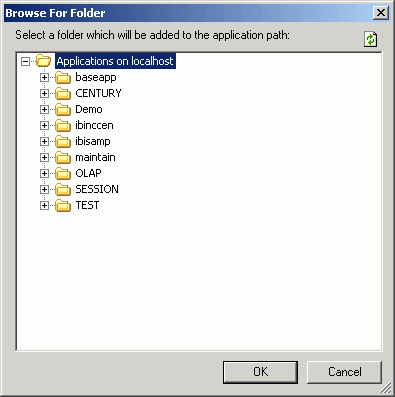
Click Add. The Browse for Folder dialog box opens.
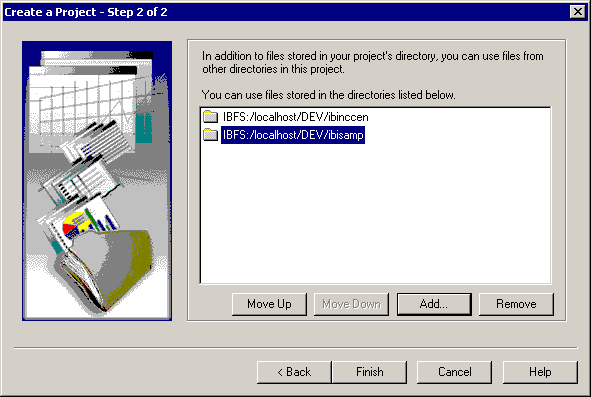
The Project Wizard displays your selections.
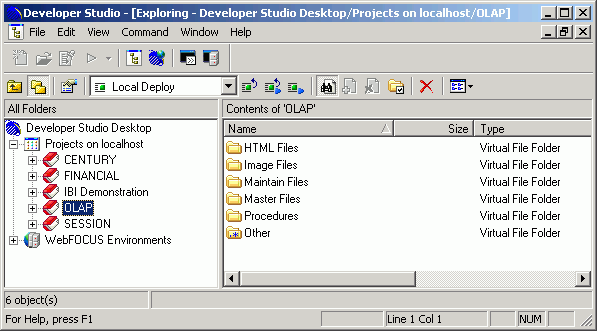
Tip: These are virtual folders, categorized in this way for your convenience. They are called virtual folders because they apply a logical structure to the project but do not actually exist as physical directories. The files listed in these folders, along with the project GFA file, are actually stored on a WebFOCUS Reporting Server and a Web/Application Server. Nevertheless, you can identify and access the files associated with a project from a folder in the local projects development area of Developer Studio, without concern for where the files actually reside.
To complete the tutorial, you will use the Master Files and Procedures folders.
Follow these steps to add master files to your OLAP project.
You will see a list of all the Master Files in the paths you specified when you created the project:
Notice that the icons are grayed out. This indicates that the files are available, but not active for your project.
The icons for these Master Files are now active for your project.
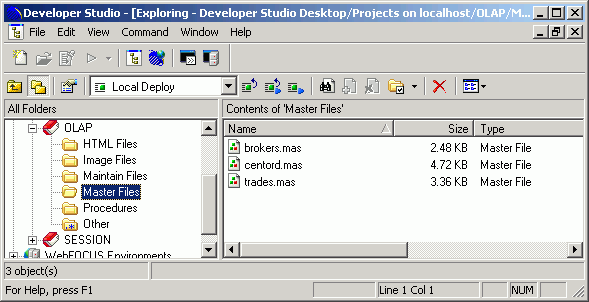
Tip: You can toggle back to the full list at any time.
To see where the corresponding data is stored:
The Master File is visible in the virtual folder in the local Projects development area, but the data source file is only visible on the server itself.
When you run a report later in this exercise, WebFOCUS will identify, locate, and read the active Master File (.MAS) for the data source (.FOC) named in the request. It will then interpret the contents of the data source based on the information in the Master File. You do not have to make the data source files active.
Notice that the ibinccen folder also contains some sample procedures (.FEX files). You will not be using these procedures. They have been created for use in demos and other exercises. For this tutorial, you will create your own OLAP-enabled procedure.
Close WebFOCUS Environments. You will create the procedure in the local projects development area.
Behind any WebFOCUS OLAP report is a hierarchical data structure. For example, a typical hierarchy of sales regions might contain a GEOGRAPHY category including the fields Region, State, and City (in descending order). Region, the highest level in this hierarchy, would contain a list of all available regions within GEOGRAPHY. State, the second highest level in the hierarchy, would contain a list of all available states within those regions, and others.
In WebFOCUS, the hierarchical structure is generally built into the Master File for a data source, where it becomes active for any report that uses that data source. Developers or administrators who are responsible for describing data in a Master File can use WebFOCUS language. The keyword WITHIN defines the elements in each dimension in the hierarchy. For details about WITHIN syntax, see the Describing Data With WebFOCUS Language manual.
In addition, those working in WebFOCUS Developer Studio have access to a variety of graphical tools that make it easy to drag and drop fields into position to form a hierarchy. The hierarchy may be global to all procedures or local to one procedure:
For details about these related tools, see the Describing Data With Graphical Tools manual.
| WebFOCUS |