Viewing Data Profiling Characteristics
Data Profiling provides data characteristics for the
columns in a synonym. You can display the characteristics for all
the columns in a synonym or segment, or for an individual column.
Note: Data Profiling is not
available if your adapter is not configured correctly.
For more information about configuring
the adapter, see Accessing Data and Creating Synonyms.
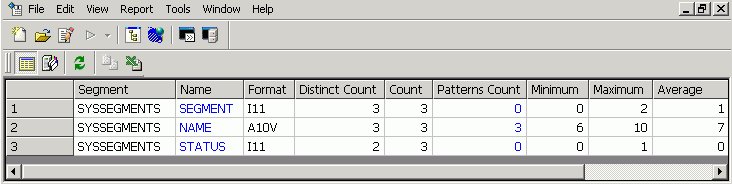
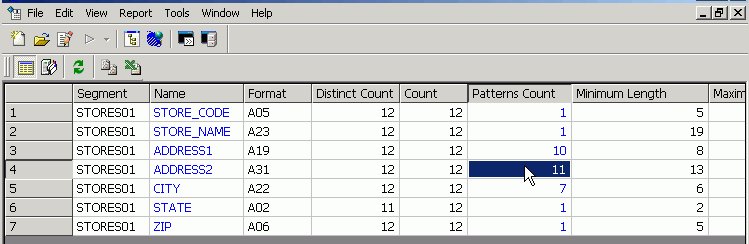
For alphanumeric columns, Data Profiling provides the segment,
format, count of distinct values, total count, patterns count, maximum,
minimum, average length, minimum and maximum values, and number
of nulls. Patterns count shows the number of patterns found in each
alphanumeric column.
For numeric columns, Data Profiling provides the segment, format,
count of distinct values, total count, maximum, minimum, average
values, and number of nulls.
Data Profiling for an individual column provides access to Statistics,
Patterns, Values, and Outliers reports.
xData Profiling a Synonym or Segment
Data Profiling provides information on all the columns
in a synonym or segment. You can also drill down to the Values or
Patterns reports for an individual column from a synonym or segment
Data Profiling report.
x
Procedure: How to View Data Profiling for a Synonym or Segment
To view the Data Profiling information
for a synonym or segment:
-
From the Projects
or Data Servers area,
open a synonym by double-clicking a Master File from the Master
Files folder.
The Synonym Editor opens to the Tree View tab.
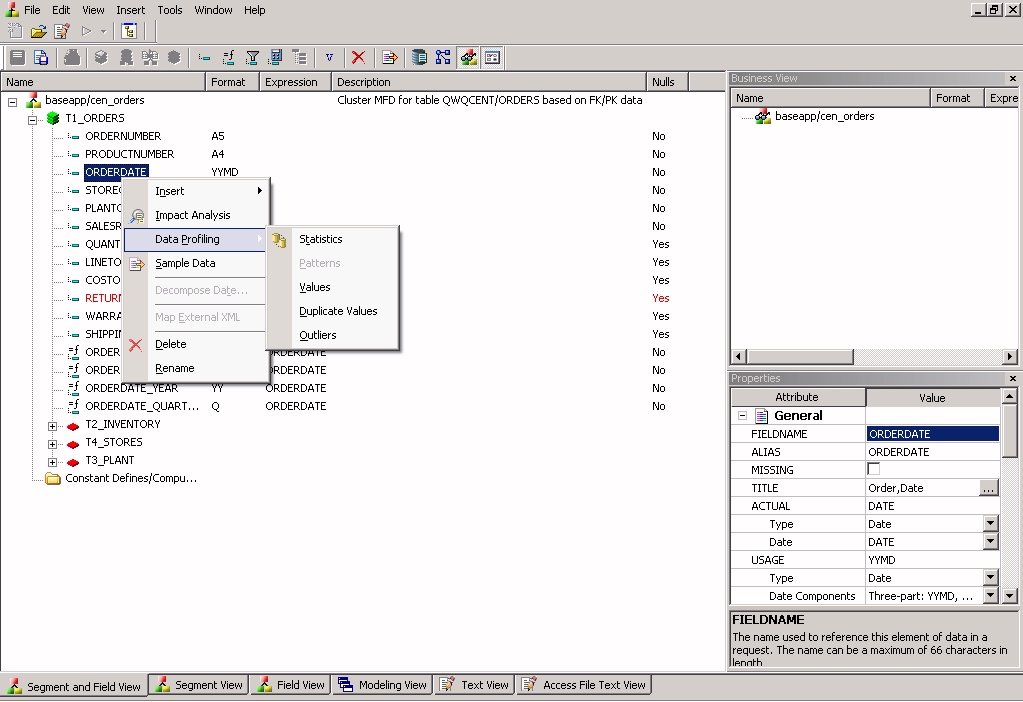
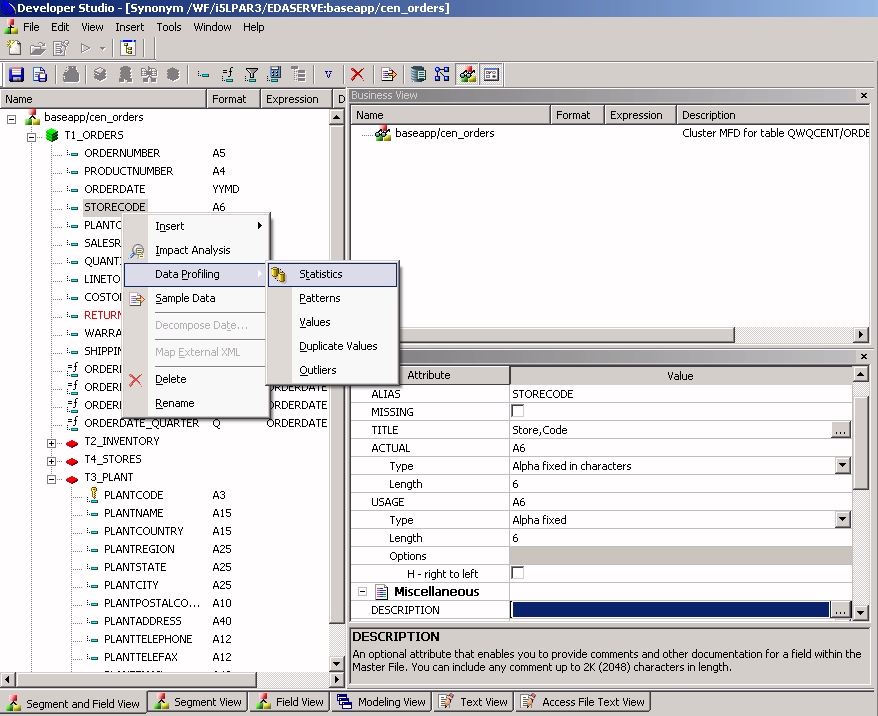
-
Right-click
the synonym or segment name and select Data Profiling.
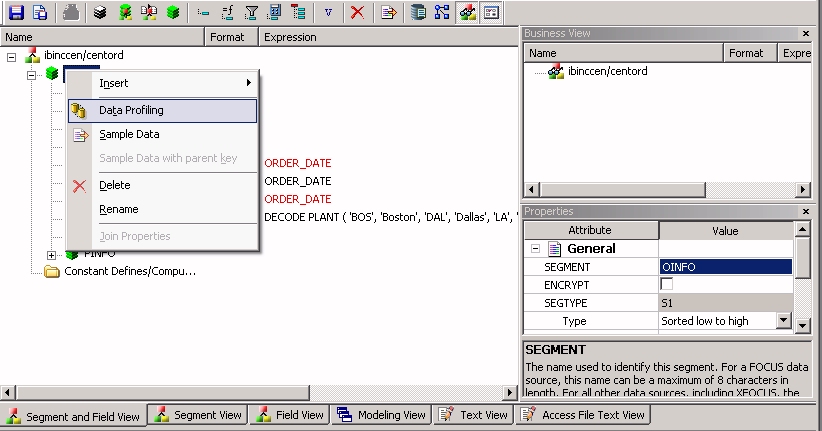
The
Data Profiling information displays in the workspace.
You may use the Data Profiling Results toolbar to view
server messages, print the report, copy data as text, and export
the report.
-
Optionally,
you can click a column name or patterns count (for alphanumeric
columns) to drill down to the Values or Patterns reports, respectively.
This is a partial Values report produced by clicking a
column name.
The image below is an example of an address
column.
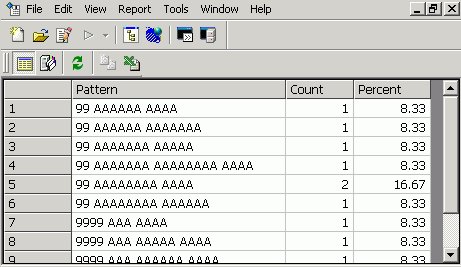
For
pattern analysis, a "9" represents a digit, an "A" represents any
uppercase letter, and an "a" represents any lowercase letter. All
printable special characters are represented by themselves, and
unprintable characters are represented by an "X".
xData Profiling a Single Column
Data Profiling for an individual column provides access
to four reports:
-
Statistics shows
the same information as a Data Profile report for a synonym or segment.
For
alphanumeric columns, the Statistics report provides the segment,
format, count of distinct values, total count, patterns count, maximum,
minimum, average length, minimum and maximum values, and number
of nulls.
For numeric columns, the Statistics report provides
the segment, format, count of distinct values, total count, maximum,
minimum, average values, and number of nulls.
-
Patterns,
which is only available for alphanumeric columns, shows patterns
of letters, digits, and special characters, as well as counts and
their percents.
-
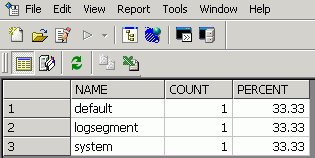
Values shows
unique values and their percents.
-
Duplicate Values shows
identical values.
-
Outliers shows
the ten highest and lowest distinct values and their counts.
These reports are available by right-clicking a column in the
Synonym Editor and selecting Data Profiling.
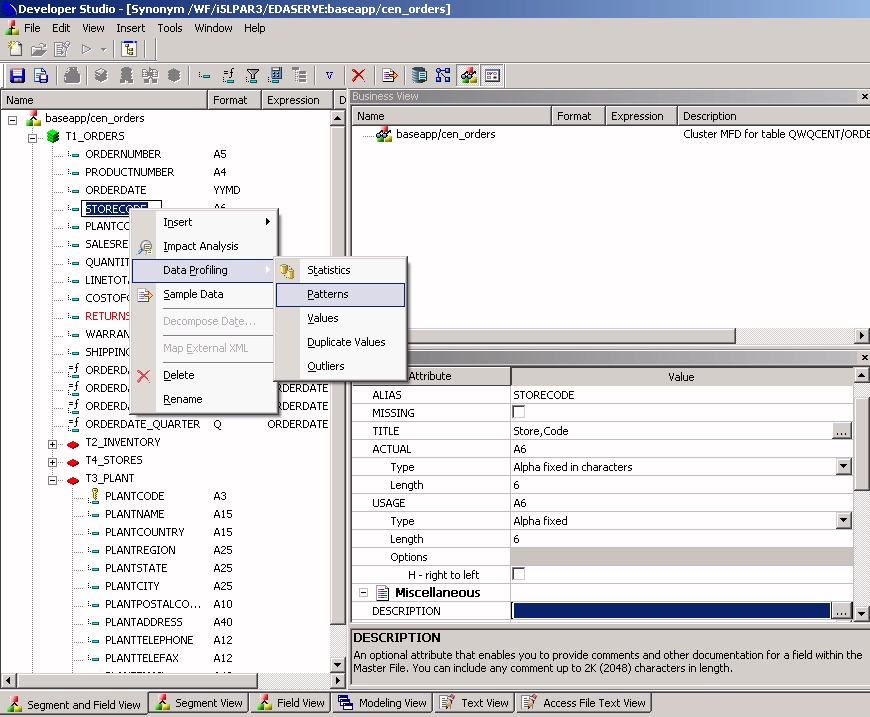
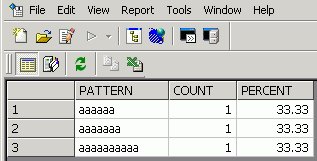
The Patterns report shows the number of
patterns found for each alphanumeric column.
Clicking a patterns count displays the
actual patterns.
The image below is an example of an address
column.
For pattern analysis, a "9" represents
a digit, an "A" represents any uppercase letter, and an "a" represents
any lowercase letter. All printable special characters are represented by
themselves, and unprintable characters are represented by an "X".
x
Procedure: How to View Data Profile Statistics
To
view the Statistical Data Profiling information for a single column:
-
From the Projects
or Data Servers area,
open a synonym by double-clicking a Master File from the Master
Files folder.
The Synonym Editor opens to the Tree View tab.
-
Right-click
a column and select Statistics from the Data
Profiling submenu.
The
Statistical Data Profiling information displays in the workspace.
-
Optionally,
you can click a column name or patterns count (for alphanumeric
columns) to drill down to the Values or Patterns reports, respectively.
x
Procedure: How to View Data Profile Patterns
Data
Profile Patterns shows patterns of letters, digits, and special
characters, as well as counts. This is only available for alphanumeric
columns.
To view the Patterns Data Profiling information
for a single column:
-
From the Projects
or Data Servers area,
open a synonym by double-clicking a Master File from the Master
Files folder.
The Synonym Editor opens to the Tree View tab.
-
Right-click
a column and select Patterns from the Data
Profiling submenu.
The
Patterns Data Profiling information displays.
For
pattern analysis, a "9" represents a digit, an "A" represents any uppercase
letter, and an "a" represents any lowercase letter. All printable
special characters are represented by themselves, and unprintable
characters are represented by an "X".
x
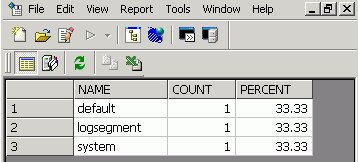
Procedure: How to View Data Profile Values
Data
Profile Values shows unique values.
To
view the Values Data Profiling information for a single column:
-
From the Projects
or Data Servers area,
open a synonym by double-clicking a Master File from the Master
Files folder.
The Synonym Editor opens to the Tree View tab.
-
Right-click
a column and select Values from the Data
Profiling submenu.
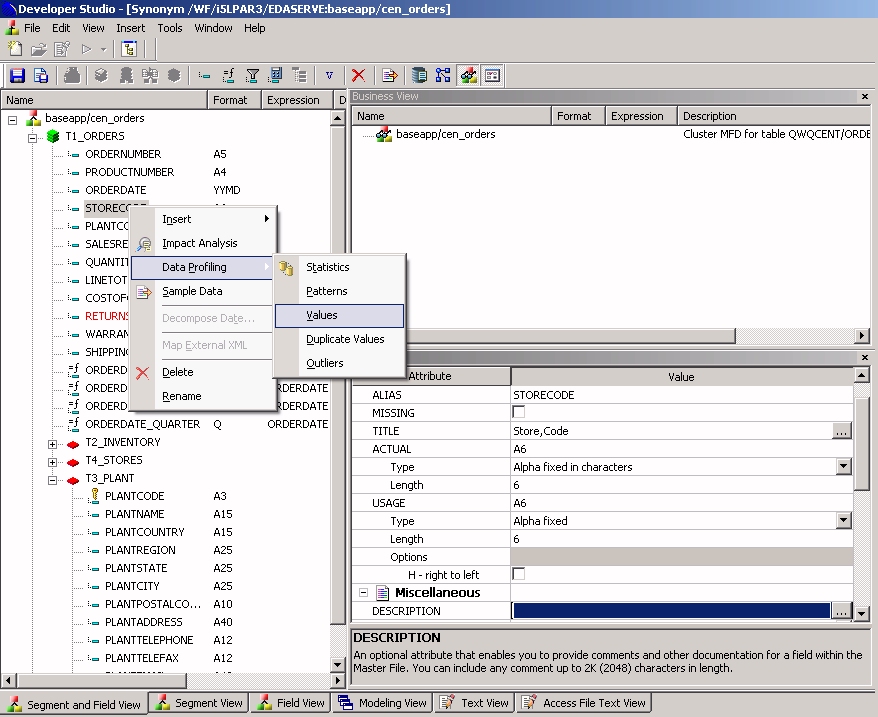
The
Values Data Profiling information displays.
x
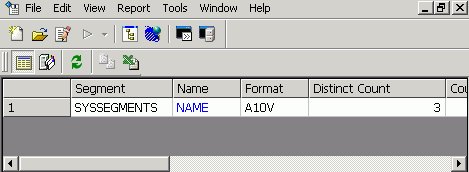
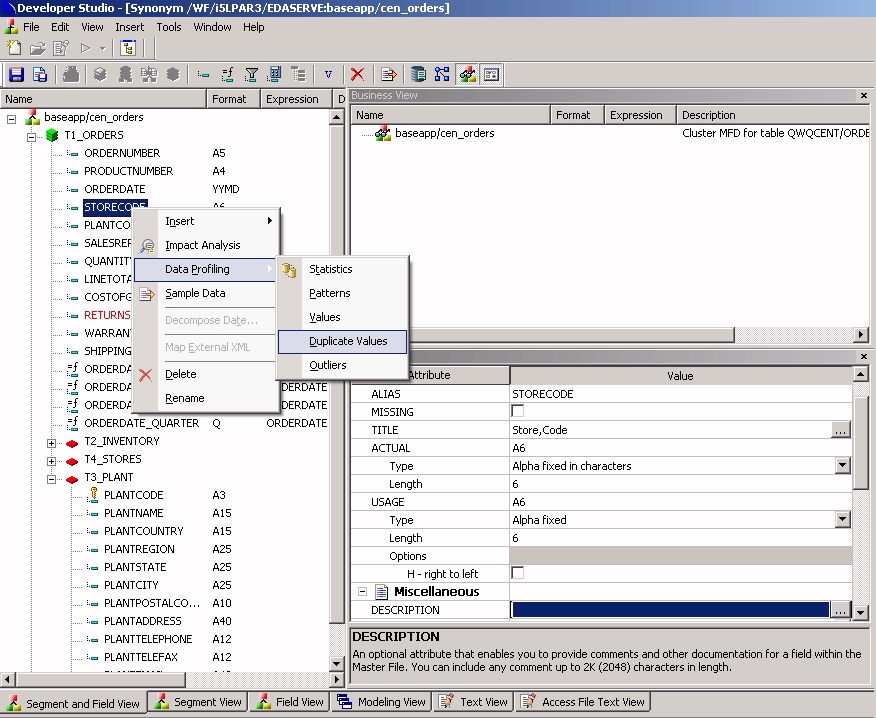
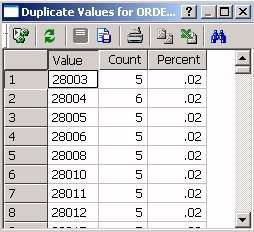
Procedure: How to View Data Profile Duplicate Values
Data
Profile Duplicate Values shows identical values.
To view the
Duplicate Values Data Profiling information for a single column:
-
Open the
synonym in the Synonym Editor by double-clicking it from the Metadata
pane or right-clicking it and selecting Open in Synonym Editor.
-
Right-click
a column and select Duplcate Values from
the Data Profiling submenu.
The
Duplicate Values Data Profiling information displays, as shown in
the following image.
x
Procedure: How to View Data Profile Outliers
Data Profile
Outliers shows the 10 highest and lowest distinct values.
To view the Outliers
Data Profiling information for a single column:
-
From the Projects
or Data Servers area,
open a synonym by double-clicking a Master File from the Master
Files folder.
The Synonym Editor opens to the Tree View tab.
-
Right-click
a column and select Outliers from the Data
Profiling submenu.
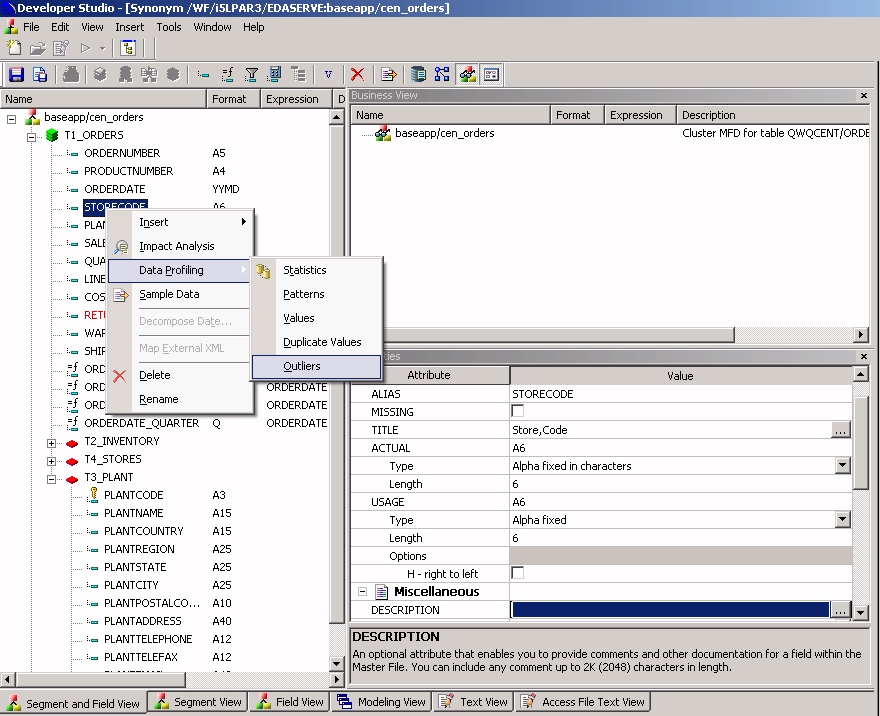
The
Outliers Data Profiling information displays.
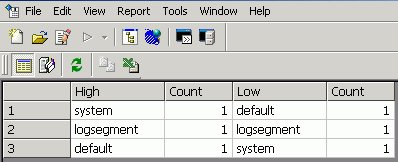
Note: Outliers produce a maximum of 10 highest and
lowest distinct values, if they exist.