In this section: |
You can view HTML, PDF, and Excel 2000 reports in your browser.
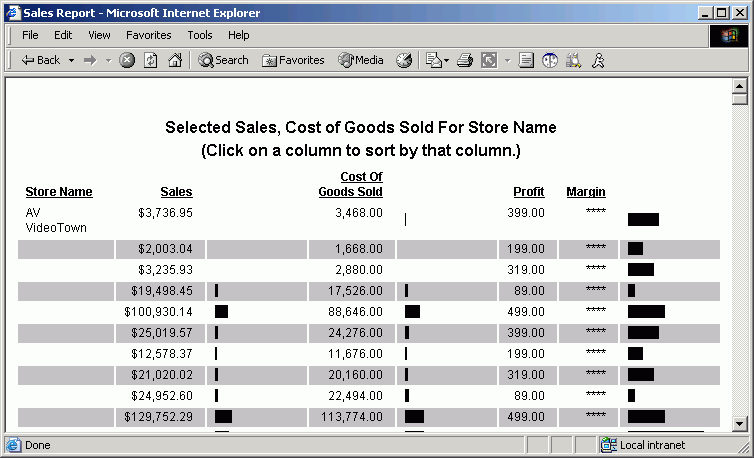
The following is a sample HTML report.
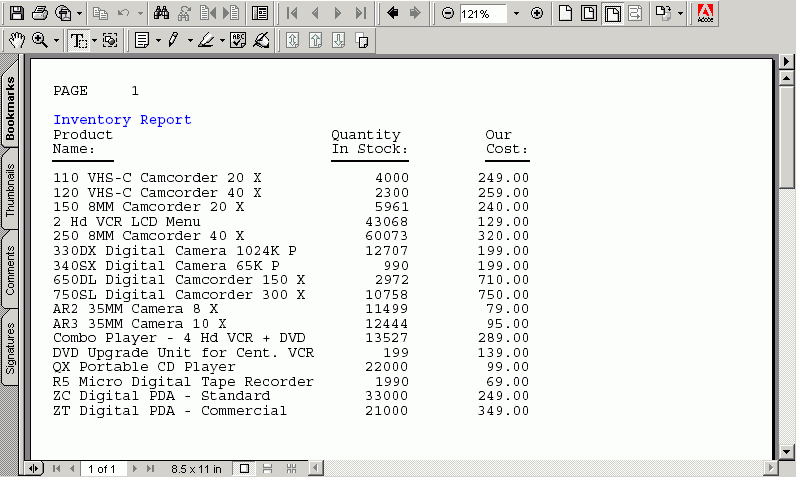
PDF format opens in Acrobat Reader, which is invoked by your browser. Unlike HTML, which does not observe certain styling options, PDF format shows all styles as you define them in the Report Painter or in a report request.
The full range of Acrobat Reader navigation options are available through your browser.
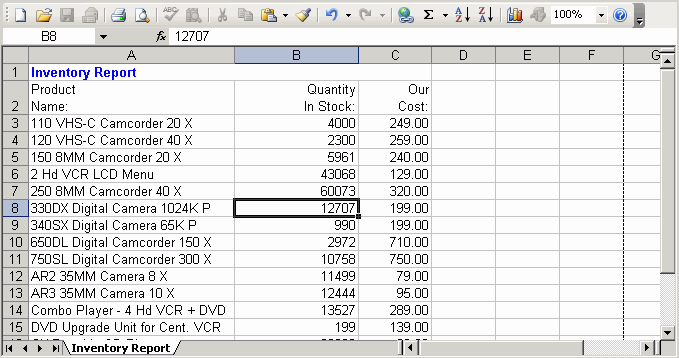
The following shows an example of a report in Excel 2000 format. When the report is run, Excel 2000 launches within your browser, offering complete Excel 2000 functionality.
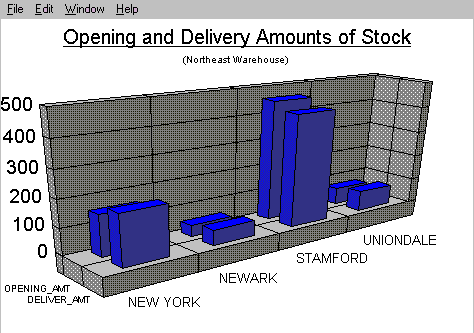
When you create and run a graph in the Graph Assistant, your output automatically appears in your browser.
You can further customize your graph by using the graph editor, which is accessible on every tab of the Graph Assistant by clicking the Edit button.
For details, see the Creating Charts With Graph Tools manual.
This graph was created and run using Graph Assistant.
| WebFOCUS |