You can sort the data in an OLAP report based on the values of
dimensions in the hierarchy and/or the values of the quantitative
measures that constitute the body of the report. Sorting options
vary depending on the nature of the data being sorted. For details, see Sorting Measures and Sorting Dimensions.
You can also group numeric data into any number of tiles (percentiles,
quartiles, deciles, etc.). See Grouping Numeric Data Into Tiles.
x
You can apply aggregation and sorting simultaneously
to a numeric measure in an OLAP report, and sort the data from high
to low (descending order) or from low to high (ascending order).
All other columns are sorted correspondingly.
For the measure being sorted, you can restrict the report to
a specified number of highest values (when sorting high to low)
or lowest values (when sorting from low to high).
When you sort a measure, any subtotals, subheadings, or subfootings
in the report are automatically suppressed since these elements
relate to a specific sort field and are not meaningful when the
report is resorted by the values in a measure column. For an illustration,
see Applying a Percent Calculation to a Measure.
Note: Sorting by measures is not available in a report
in which measures have been stacked. See Hiding and Displaying Measures.
x
Procedure: How to Sort Measures High to Low/Low to High in an OLAP Report
To sort the values of a measure from
high to low:
- Click the top
half of the diamond
 button.
or
- Right-click
the measure and select Sort By Highest from the
menu.
The report runs automatically. The highest value
is now first in the column. The top of the diamond button becomes
solid blue to indicate the current sort direction.
To sort
the values of a measure from low to high:
- Click the bottom
half of the diamond button.
or
- Right-click
the measure and select Sort By Lowest from
the menu.
The lowest value is first in the column. The
bottom of the diamond button becomes solid blue.
Tip: After
a measure has been sorted, clicking the upper or lower half of the diamond
button inverts the sort order of that measure. Place your mouse
over either half of the diamond to see a message that indicates
the next sort order that will occur if you click that half of the
diamond.
Example: Sorting a Measure From High to Low in the Report
The
following is an example of sorting a measure from high to low in
the report.
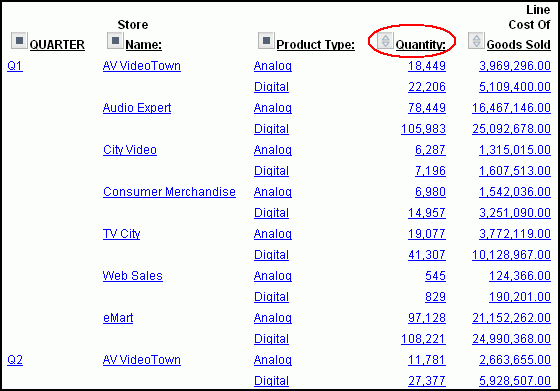
- Run the Standard
Report OLAPREP2.
The
OLAP report shows sales information sorted by quarter, store, and
product type.
You are interested in seeing where the greatest
quantity of goods have been sold.
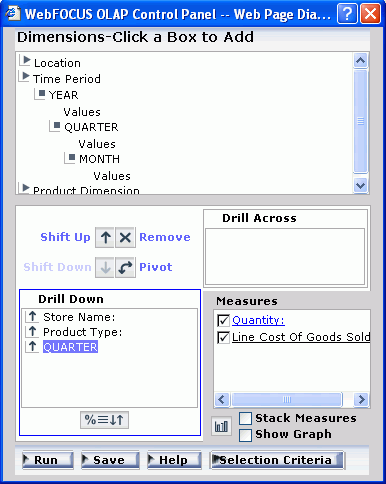
- Click the top
half of the diamond button next to the Quantity measure, as shown
in the following image, to sort the values from high to low.
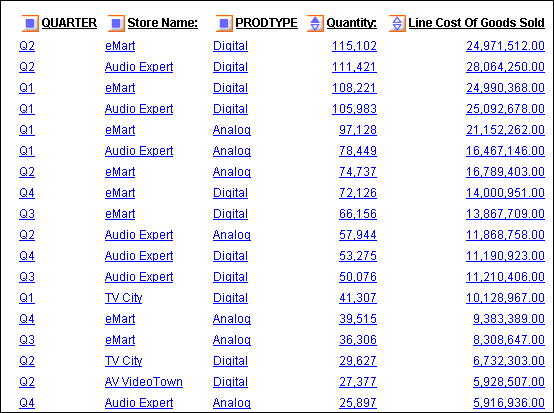
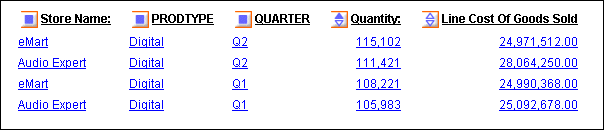
As
shown in the following image, the report now shows data values for
the Quantity measure in descending order. The top half of the diamond
next to Quantity is blue and solid to indicate the current sort
order of the measure. This is now the controlling sort in the report.
All other values are reordered correspondingly.
Tip: To
invert the sort order, click either the solid or hollow part of
the diamond button.
x
Procedure: How to Sort Measures High to Low/Low to High From the Control Panel
-
Open
the OLAP Control Panel.
-
Click
a measure in the Measures pane to open the sort options pane (do
not click the Measures check pane which controls the display of
a measure, not its sorting).
Verify that the Sort panel is checked (this setting is
required to apply sorting specifications to the selected measure).
-
Select
the High to Low or Low to High options
button to specify the sort order you wish to apply. The default sort
order is high to low.
-
Click OK.
The sort pane is replaced by the Measures pane, where the
measure becomes blue to indicate that sorting specifications have
been defined.
-
Click Run to
display the report with sorting applied to the selected measure.
The diamond button next to the sorted measure changes to
reflect the sort order. If high to low, the top half of the diamond
is solid blue. If low to high, the bottom half is solid blue.
Note:
- Report execution
is automatic when you sort a measure in an OLAP report. However,
if the Control Panel is open, all current changes in the Control
Panel are applied.
- If an OLAP
request contains a horizontal (Across) sort field, the measures
appear several times in the report, once for each Across value.
If you apply sorting to a measure, the sort is performed on the
first column occurrence of the measure, and reflected in all subsequent
instances. The appropriate half of the diamond button becomes solid
only for the first instance. Any additional sorting you wish to
perform must be done from the first occurrence of the measure.
x
Procedure: How to View a Subset of Data for Sorted Measures
You
can select to view only a subset of the total number of records
in your report.
-
Open
the OLAP Control Panel.
-
Click
a measure name in the Measures pane to open the sort options pane
(do not click the Measures check pane which controls the display
of a measure, not its sorting).
Verify that the Sort check panel
is selected (this setting is required to apply sorting specifications
to a measure).
-
Select
the Rank check pane, then specify the number
of sort field values to be included in the report.
- Use the spin
buttons located to the right of the word Highest or Lowest to increase
or decrease the number of sort fields.
or
- Position the
cursor in the input pane and type a number.
The default
number of sort fields values is 5.
-
Click OK.
The sort pane is replaced by the Measures pane, where the
measure becomes blue to indicate that sorting specifications have
been defined.
-
Click Run to
display the report with the designated number of sorted values.
Example: Displaying a Subset of Sorted Data for a Measure
The
following is an example of displaying a subset of sorted data for
a measure.
- Run the Standard
Report OLAPREP2.
The
report shows sales information sorted by quarter, store, and product
type.
- Click the square
icon next to QUARTER to open the Control Panel (notice that the original
report is open on the left).
- Click Quantity in
the Measures pane.
The sort pane opens, as shown in the following
image, in front of the report.
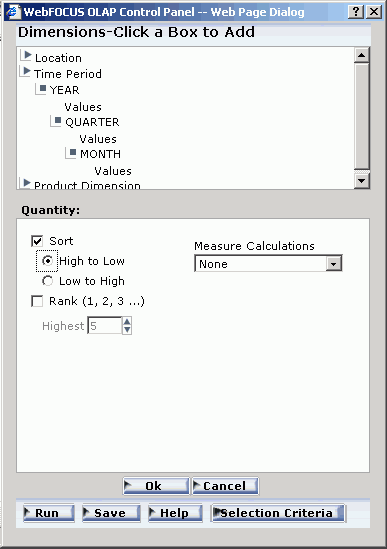
- If not already
selected, click the Sort check pane.
High
to low sorting is selected by default.
- Click the Rank check
pane.
Because the report is being sorted from high to low, you
can indicate the number of values you wish to see, beginning with
the highest.
- Specify Highest 4.
- Click OK.
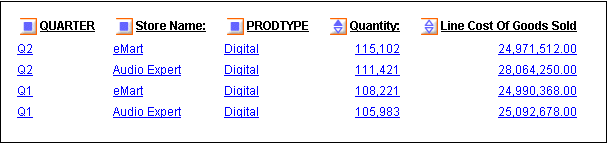
The
main Control Panel window appears. In the Measures pane the Quantity measure
is blue to indicate that sorting specifications have been defined.
- Click the Run button
at the bottom of the Control Panel.
As shown in the following
image, the report now shows Quantity sorted from high to low with
the highest four values appearing.
x
Procedure: How to Remove Sorting Criteria for a Measure
You
can remove sorting specifications for a measure whether the measure
appears or is hidden.
-
Open
the OLAP Control Panel.
-
In the
Measures pane, click the measure for which you want to remove sorting
specifications.
-
Clear
the Sort check pane.
-
Click OK.
x
There are several ways in which you can sort dimensions
in an OLAP hierarchy. You can:
- Control the
order in which data is sorted: ascending or descending.
- Restrict sort
field values to a specified number of either highest or lowest values.
- Assign a rank
number to each row in a vertically sorted report.
- Shift the positions
of sort fields in the report. For example, you can change from sorting
by State and then by Product to sorting by Product and then by State.
- Pivot a vertical
(By) sort field to make it a horizontal (Across) sort field and
vice versa.
- Hide a sort
field in the report while retaining the sorting associated with
it. For example, you can sort data by quarters without showing the
Quarter column.
- Group numeric
data in tiles (for example, percentile, decile, and so on).
x
Procedure: How to Change Sort Order for a Dimension
-
Open
the Control Panel.
-
Select
a field from the Drill Down or Drill Across pane.
-
Click
the Sort
 button.
The sort pane opens.
-
Under
Sort Order, choose the Low to High or High
to Low options button (Low to High is the default for
a dimension).
-
Click OK.
The main Control Panel window reopens.
-
Click Run to
execute the report.
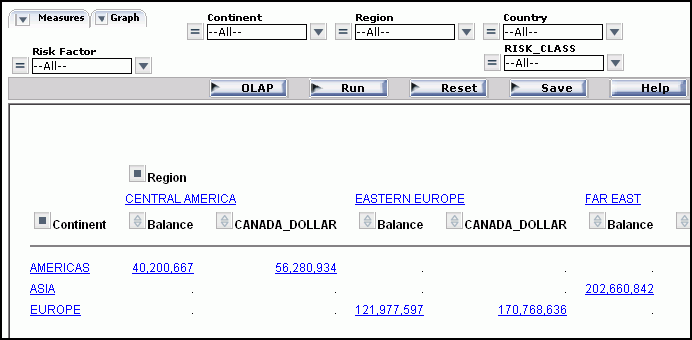
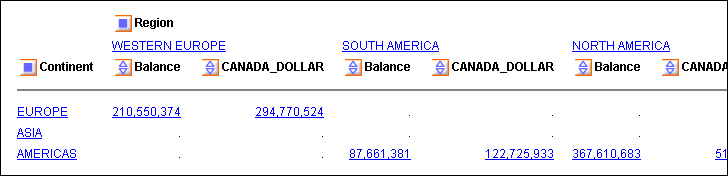
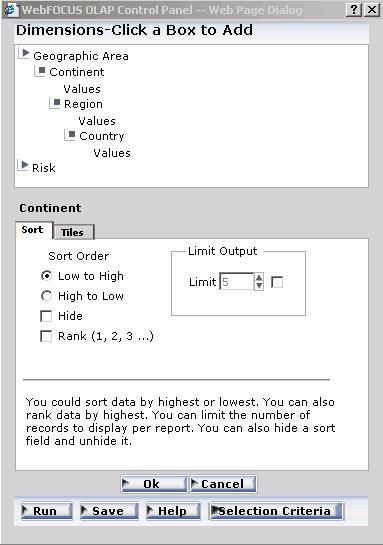
Example: Inverting the Sort Order of a Dimension
The
following is an example of inverting the sort order of a dimension.
- Run the Standard
Report OLAPREP4.
In
the report, the values of both sort fields (Continent and Region)
are sorted from low to high (A to Z), as shown in the following
image.
- To sort the
report in reverse alphabetical order, click the OLAP button
on the band below the Selections pane to open the Control Panel.
- Select Continent in
the Drill Down pane and click the Sort
button.
The
sort pane opens.
- Under Sort
Order, choose the High to Low options button, as
shown in the following image, on the OLAP Control Panel.
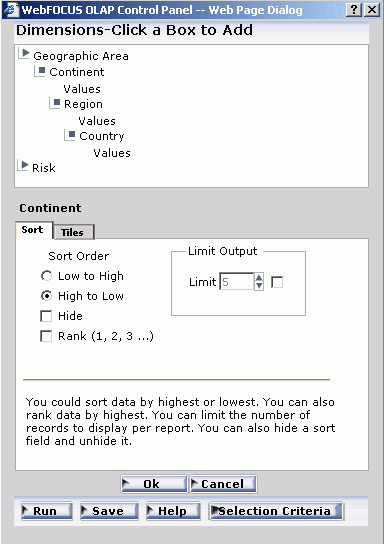
- Click OK.
The
main Control Panel window reopens.
- Repeat the process for Region: select Region in
the Drill Across pane and click the Sort button.
When the sort pane opens, select the High to Low options
button and click OK.
The
main Control Panel window opens.
- Click the Run button.
Both
dimensions are now sorted in inverse alphabetical order (Z to A),
as shown in the following image.
x
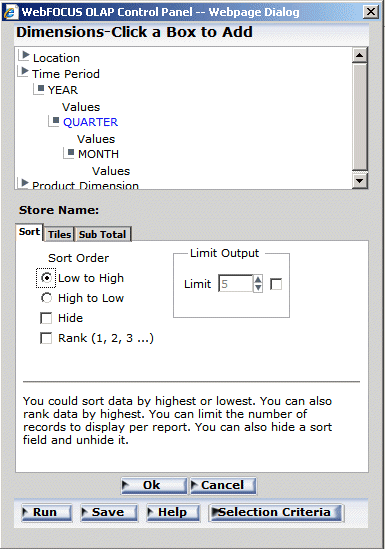
Procedure: How to Restrict the Display of Sort Values
To
restrict the display of sort field values to a certain number of
highest or lowest values:
-
Open
the OLAP Control Panel.
-
Select
a field from the Drill Down pane.
-
Click
the Sort
button.
The sorting pane opens.
-
Under
Sort Order, choose the Low to High or High
to Low options button, as shown in the following image, on
the OLAP Control Panel.
-
Under
Limit Output, click the Limit check pane and
choose or type a value in the input area.
-
Click OK.
The main Control Panel window reopens.
-
Click Run to
execute your report.
x
Procedure: How to Rank Rows in a Vertically Sorted Report
-
Open
the OLAP Control Panel.
-
Select
a field from the Drill Down pane.
-
Click
the Sort
button.
The sort pane opens.
-
Under
Sort Order, choose the Low to High or High
to Low options button.
-
Click
the Rank check pane.
-
If you
wish to place a restriction on the number of sort field values to rank,
click the Limit check pane, and choose or
type a value in the input area.
- If the High
to Low option button is selected, you can rank a specified
number of Highest values.
- If the Low
to High option button is selected, you can rank a specified
number of Lowest values.
-
Click OK.
The main Control Panel window reopens.
-
Click Run to
execute your report.
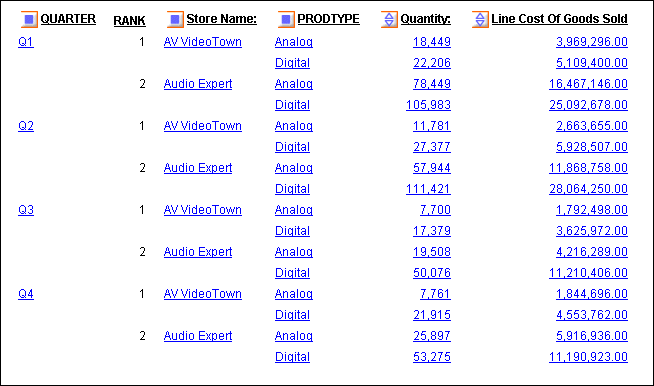
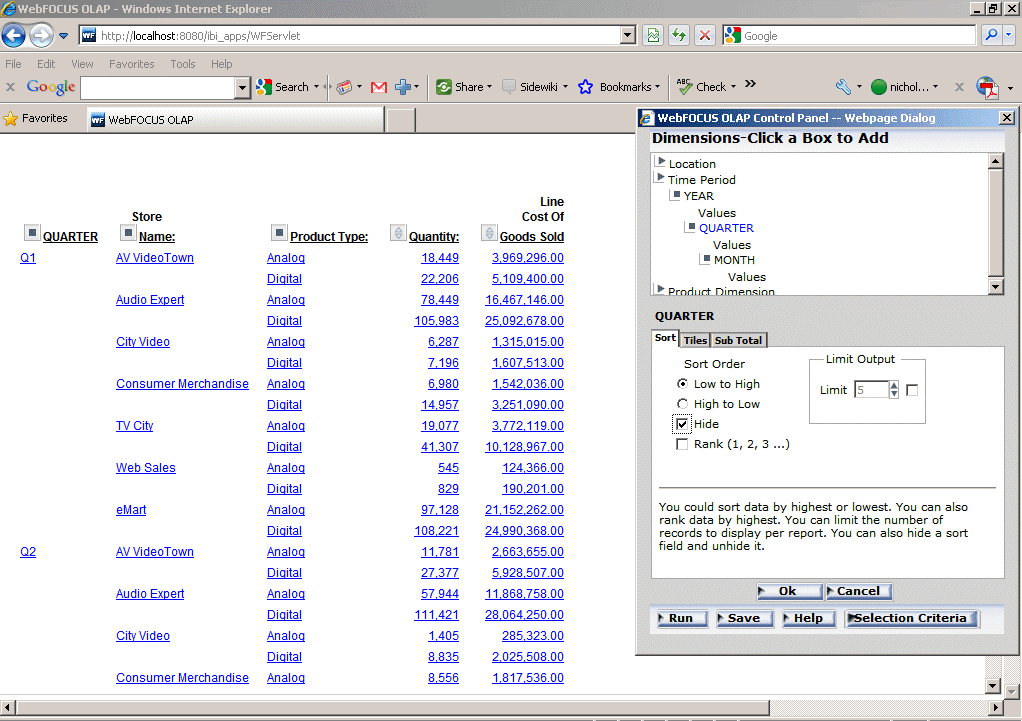
Example: Ranking and Restricting the Number of Sort Values
The
following is an example of ranking and restricting the number of
sort values.
- Run the Standard
Report OLAPREP2.
Information
for all stores is shown for each quarter. You want to see quarterly information
for only the first two stores in alphabetical order (low to high).
- Click the square
icon next to QUARTER to open the Control Panel (notice that the original
report is open at the left).
- Choose Store
Name in the Drill Down pane and click the Sort
button.
The
sort pane opens.
The following image shows these three selections
on the OLAP Control Panel.
- Accept the
default sort order: Low to High.
- Click the Limit check
pane and choose 2 from the input area.
- Click the Rank check
pane.
- Click OK to
return to the main Control Panel window.
- Click the Run button
at the bottom of the Control Panel.
Notice that only two values
now appear for each Quarter and ranked low to high within each group,
as shown in the following image.
x
Procedure: How to Reposition Sort Fields in an OLAP Report
You
can change the order in which data is sorted and presented in the
report. For example, you can change from sorting by State and then
by Product to sorting by Product and then by State. If you want
to reposition:
- Vertical (By)
sort fields, drag and drop a field into a new column position.
- Horizontal
(Across) sort fields, drag and drop the lower field above the higher
one or the higher field above the lower one.
In each
case, the cursor changes to a plus sign (+) to indicate acceptable
places into which you can drop the field. Unacceptable positions
are shown by a circle with a slash across the center.
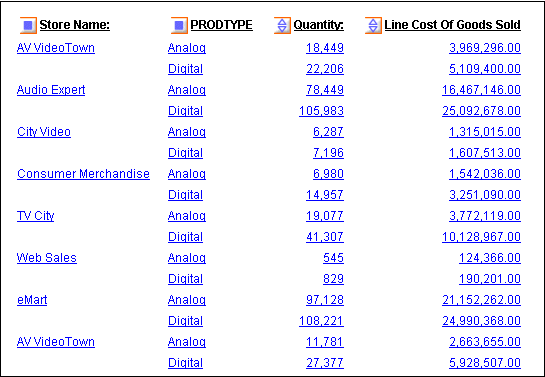
Example: Repositioning Sort Fields in an OLAP Report
The
following is an example of repositioning sort fields in an OLAP
report.
- Run the Standard
Report OLAPREP2.
- Click the top
half of the diamond button next to Quantity to
sort values from high to low.
The dimension values adjust accordingly.
The report now shows the Quantity values from high to low but according
to the QUARTER sort order, as shown in the following image.
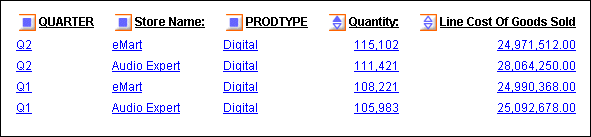
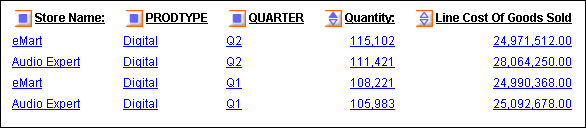
You
would like to change the sort order in the report, making Store
Name the first sort field, followed by PRODTYPE and QUARTER.
- Drag QUARTER after
PRODTYPE.
The cursor changes to a plus sign (+) to indicate acceptable
places into which you can drop the field.
The report changes
immediately, as shown in the following image, with the Store Name
being the first sort order.
x
Procedure: How to Reposition Sort Fields From the Control Panel
-
Open
the OLAP Control Panel.
-
Select
a field in the Drill Down or Drill Across pane.
-
Click
the Shift Up or Shift Down arrow
until the field is in the desired position.
Repeat for other fields as needed.
-
Click Run to
execute your report.
Example: Repositioning Sort Fields From the Control Panel
The
following is an example of repositioning sort fields from the Control
Panel.
- Run the Standard
Report OLAPREP2.
- Click the top
half of the diamond button next to Quantity to sort values from
high to low.
The dimension values adjust accordingly. The report
now shows the Quantity values from high to low but according to
the QUARTER sort order, as shown in the following image.
You
would like to change the sort order in the report, making Store
Name the first sort field, followed by PRODTYPE and QUARTER.
- Click the square
icon button next to QUARTER to open the Control Panel.
- Select Quarter from
the Drill Down pane.
- Click the Shift
Down arrow twice.
QUARTER is now the third item in
the Drill Down list, as shown in the following image.
- Click the Run button
at the bottom of the Control Panel.
QUARTER appears in the third
column of the report, as shown in the following image.
x
Procedure: How to Hide a Sort Field
In
OLAP, you can hide a sort field by clicking the Hide check
box in a report.
Note: In past releases, the text "(hidden)"
was displayed to the right of the field name in the Drill Down pane
in the OLAP Control Panel. Beginning with Version 7 Release 7.02,
hidden sort fields are indicated by reversing the color of the icon
that appears at the left of the field name.
-
Enter the
following code in an ad hoc page.
-OLAP ON
TABLE FILE CAROLAP
SUM CAROLAP.BODY.DEALER_COST
CAROLAP.BODY.RETAIL_COST
BY CAROLAP.ORIGIN.COUNTRY
BY CAR
END
-
Open the
OLAP Control Panel.
-
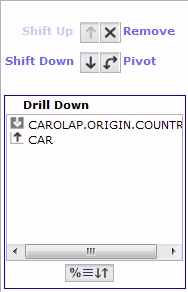
Double-click
on the Country field in the Drill Down panel
of the OLAP Control Panel. In the resulting window panel, select
the Hide check box.
-
Click OK.
Notice that the color of the sort icon has been
reversed. The Drill Down panel now appears as shown in the following
image.
x
Procedure: How to Pivot Rows and Columns In an OLAP Report
You
can quickly change a field from one that sorts data vertically,
creating rows, to one that sorts data horizontally, creating columns,
or vice versa.
To change a:
- Vertical (By)
sort field to a horizontal (Across) sort field, drag and drop a
field above the row of column titles.
- Horizontal
(Across) sort field to a vertical (By) sort field, drag and drop
the field into the desired location in the row of column titles.
In
each case, the cursor changes to a plus sign (+) to indicate acceptable
places where you can drop the field. Unacceptable places have a
circle with a slash across the center.
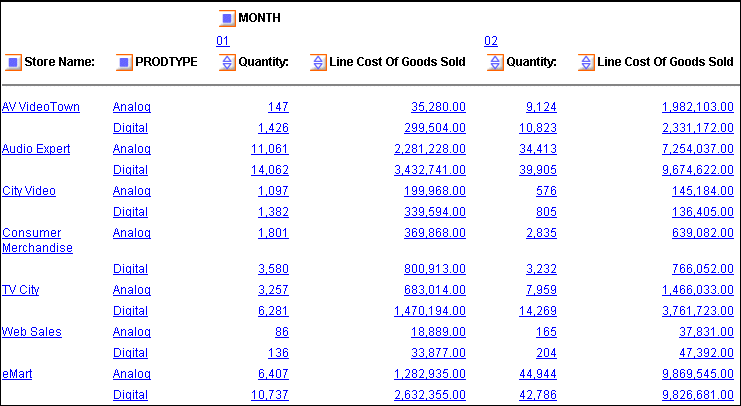
Example: Pivoting Rows and Columns in a Report
The
following is an example of pivoting rows and columns in a report.
- Run the Standard
Report OLAPREP2.
- Click Q1.
The
report is now sorted vertically, by month, store, and product type,
as shown in the following image.
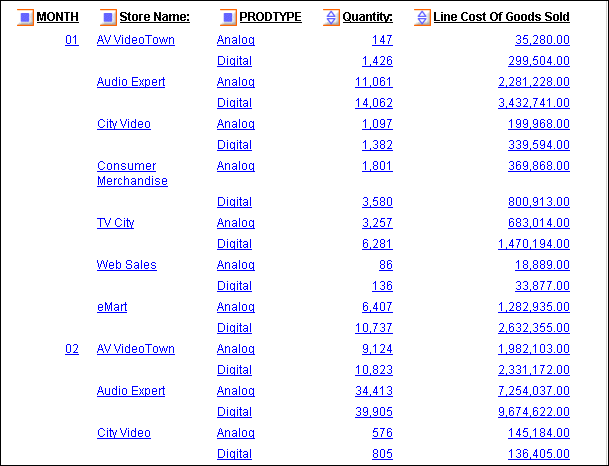
You
want to create a matrix in which data is sorted horizontally by
month, and vertically by store and product type.
- Drag Month above
the report to sort data horizontally (Across).
The cursor changes
to a plus sign (+) to indicate acceptable places where you can drop
the field.
In the new report, Quantity and Line Cost of Goods
Sold are repeated horizontally for each month, as shown in the following
image.
x
Procedure: How to Pivot Rows and Columns From the Control Panel
You
can change a field from one that sorts data vertically, creating
rows, to one that sorts data horizontally, creating columns, or
vice versa.
-
Open
the OLAP Control Panel.
-
Select
the title of the row or column you want to pivot in the Drill Down or
Drill Across pane.
-
Click
the Pivot
 button.
The title appears in the new location.
button.
The title appears in the new location.
-
Click Run to
execute your report.
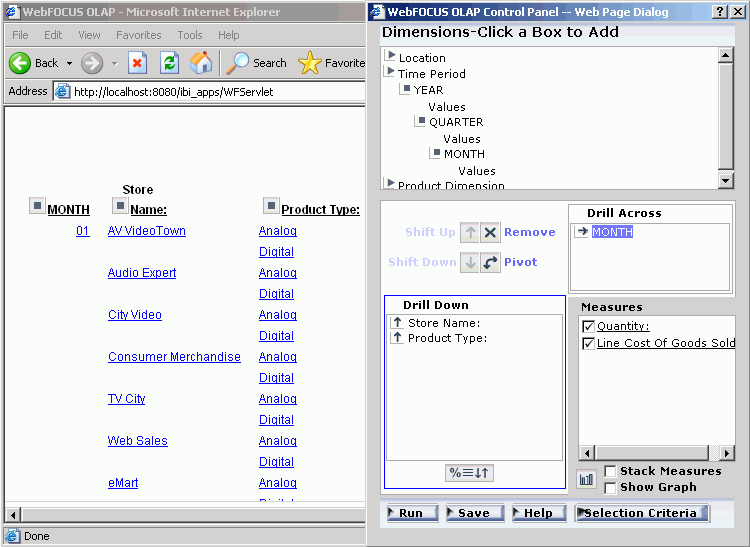
Example: Pivoting Rows Into Columns From the Control Panel
The following is an example of pivoting
rows into columns from the Control Panel.
- Run the Standard
Report OLAPREP2.
- Click Q1.
The
report is now sorted vertically, by month, store, and product type,
as shown in the following image.
You
want to create a matrix in which data is sorted horizontally by
month, and vertically by store and product type.
- Click the square
icon next to MONTH to open the Control Panel.
- Select Month in
the Drill Down pane and click the Pivot
button.
Month
moves into the Drill Across pane, as shown in the following image.
- Click the Run button
on the Control Panel.
In the new report, Quantity and Line Cost
of Goods Sold are repeated horizontally for each month, as shown
in the following image.
x
Procedure: How to Sort by a Field Without Displaying the Sort Column
To
use a field to sort your data, but not show the sort field as a
column in the report:
-
Open
the OLAP Control Panel.
-
Select
a field in the Drill Down or Drill Across pane.
-
Click
the Sort
button.
The sort pane opens.
-
Under
Sort Order, click the Hide check pane.
-
Click OK.
The main Control Panel window reopens.
-
Click Run to
execute the report.
Tip: To
expose the hidden sort field, repeat the process and deselect the Hide check
pane.
Example: Sorting by a Hidden Field
The following is an example of sorting
by a hidden field.
- Run the Standard Report OLAPREP2.
The first sort field in the report is
QUARTER. You want to retain the sorting but not display this field.
- Click the square icon next to QUARTER
to open the Control Panel.
- Select QUARTER in
the Drill Down pane, then click the Sort
button.
The sort pane opens.
- Select the Hide check
pane, as shown in the following image.
- Click OK.
The
main Control Panel window reopens.
- Click the Run button
in the Control Panel.
Report sorting is unchanged, but the QUARTER
column no longer appears, as shown in the following image.
xGrouping Numeric Data Into Tiles
You can group numeric data into any number of tiles
(percentiles, deciles, quartiles, and so on) in tabular reports.
For example, you can group student test scores into deciles to determine
which students are in the top ten percent of the class.
Grouping is based on the values in the selected vertical (BY)
field and data is apportioned into the number of tile groups you
specify.
The following occurs when you group data into tiles:
- A new column
(labeled TILE by default) is added to the report output and displays
the tile number assigned to each instance of the tile field. You
can change the column title in the Tiles section of the OLAP Control
Panel.
- Tiling is calculated
within all of the higher-level sort fields in the request and restarts
whenever a sort field at a higher level than the tile field value
changes.
- Instances are
counted using the tile field. If the request displays fields from
lower level segments, there may be multiple report lines that correspond
to one instance of the tile field.
- Instances with
the same tile field value are placed in the same tile. For example, consider
the following data, which is to be apportioned into three tiles:
1
5
5
5
8
9
In
this case, dividing the instances into groups containing an equal
number of records produces the following table:
|
Group
|
Data Values
|
|---|
|
1
|
1,5
|
|
2
|
5,5
|
|
3
|
8,9
|
However, because all of the same data values
must be in the same tile, the fives (5) that are in group 2 are
moved to group 1. Group 2 remains empty. The final tiles look like
the following table:
|
Tile Number
|
Data Values
|
|---|
|
1
|
1,5,5,5
|
|
2
| |
|
3
|
8,9
|
x
Procedure: How to Group Data Into Tiles in an OLAP Report
-
Open
the OLAP Control Panel.
-
Select
a numeric or date field from the Drill Down pane.
-
Click
the Sort button. Click the Tiles tab.
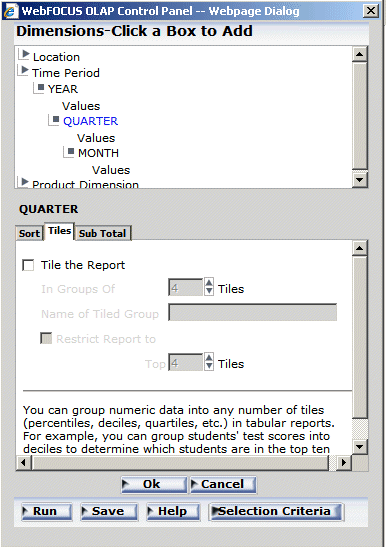
-
Click
the Tile the Report check pane.
-
In the In
Groups Of input area, select the number of tiles to
be used in grouping the data. For example, 100 tiles produces percentiles
or 10 tiles produces deciles.
-
In the Name
of Tile Group input pane, type a name for the Tile column.
-
In the Restrict
Report to only the Top input area, select the number
of tile groups to display in the report.
-
Optionally,
select a Sort Order option button:
- Choose High
to Low to sort data in descending order so that the
highest data values are placed in tile 1.
- Choose Low
to High to sort data in ascending order so that the
lowest data values are placed in tile 1. This is the default.
-
If you
wish to specify the highest tile value to appear in the report, select
a value from the Limit input area. For example, if you enter a Limit
of 3, the report will not display any data row that is assigned
a tile number greater than 3.
-
Click OK to
accept the selections and return to the main Control Panel window.
-
Click Run to
reexecute and view the report.