Saving Reports Using Excel Formats
In this section: How to: Reference: |
You can display a report as one of several kinds of Microsoft
Excel spreadsheets. The report opens in Excel within a Web browser.
You can display a report as an:
-
Excel 2000 worksheet (format EXL2K). The
Excel 2000 format supports most StyleSheet attributes, allowing
for full report formatting. The computer on which the report appears
must have Microsoft Excel 2000 or higher installed.
In addition,
WebFOCUS supports two Excel 2000 variations: EXL2K FORMULA and EXL2K
PIVOT. When either of these formats is specified additional processing
is done.
-
Excel 2000 FORMULA (EXL2K FORMULA). If
you display a report using the format variation EXL2K FORMULA, the
resulting spreadsheet will contain Excel formulas that calculate
and display the results of any type of summed information (such
as column totals, and row totals.)
-
Excel 2000 PivotTable (format EXL2K PIVOT). PivotTable
is an Excel tool for analyzing complex data, much like WebFOCUS
OLAP. Note that a report displayed as a PivotTable spreadsheet may
not retain its formatting if you insert an additional field from
the pivot cache, move a column position, or remove a field from
the PivotTable.
-
Excel 2007 worksheet (format EXL07). Excel
2007 enables you use the Microsoft Office Excel 2007 features with
your report. Excel 2007 must be installed in order to run reports
using the Excel 2007 output format.
-
Excel 97 spreadsheet (format EXL97). Excel
97 is an HTML-based display format that opens in Excel 97 or higher
and supports report formatting and drill-downs. The computer on
which the report appears must have Microsoft Excel 97 installed.
-
Note: Since
only single line (single cell) column titles are supported in format
EXCEL reports, any additional column title rows are treated as data.
For example, if you have a report with a multi-line (multi-cell)
column title and you sort the column, the second (and so on) column
title rows will be sorted with the data. To avoid this, only select
the data instead of the entire column when you select sorting options in
Excel.
For details about displaying reports in Excel formats, see Choosing a Display Format in the Creating
Reports With WebFOCUS Language manual.
x
Procedure: How to Create an EXL2K Report in Internet Explorer
The
following example illustrates how to create a report in EXL2K format:
-
After
selecting the CENTCOMP data source to report against, open the Report
Painter.
-
Type
STORE NAME BY STATE in the heading area.
-
Move
the insertion point to the report and add the following fields from the
Object Inspector: STATE, REGION, STORE_CODE,
and STORENAME.
-
Select
the Store Name column and click the Sum button.
-
Select
the State, Region,
and Store ID columns and click they By button.
-
Select Format from
the Report menu. The Report Options dialog box opens at the Format
tab.
-
Set
your report output format to Excel 2000 by selecting Excel
2000 (EXL2K) from the Select Format drop-down list.
-
In the
Customize worksheet title field, type State Report.
-
Click OK,
then click Run.
The
output is:
Notice
that the tab name has been changed from the Excel default, Sheet1,
to a more descriptive name, which you specified in the Customize
worksheet title input field on the Format tab of the Report Options
dialog box.
x
Reference: Font Support for EXL2K Format
The
EXL2K format supports fonts that are available on both the server
and the client. Be sure to verify the existence of a particular
font on both the client and the server before saving a report in
the EXL2K format.
x
Reference: Unsupported Date and Numeric Formats
The
following formats are not supported in EXL2K. They will translate
into Excel General format and possibly produce unpredictable results:
- YY, Y, M, D,
JUL, and I2MT.
- Any date format
with a Q (quarter).
- Any packed-decimal
(P) date formats.
- Any alphanumeric
(A) date formats.
- Fixed Dollar
(N) formats.
- Multiple format
options. Only single format options are supported when using FORMAT
EXL2K. For example, the formats I9C and I9B are supported, but I9BC
is not.
x
Reference: Using Date Separators in Excel
In
order to use a "-" as a separator between month, day, and year in
Excel, you must change the default date separator for Windows®.
This setting can be located under Regional Options in the Control
Panel.
xUsing PivotTables in Excel 2000
The power of EXL2K format derives in large measure from
its ability to take advantage of PivotTables. The PivotTable is
a tool used in Microsoft Excel to analyze complex data much like
the OLAP tool in WebFOCUS. It allows you to drag and drop data fields
within a PivotTable, providing different views of the data, such
as sorting across rows or columns.
Report requests can be created within WebFOCUS and sent as output
to a fully formatted Excel PivotTable. The ON TABLE PCHOLD FORMAT
EXL2K PIVOT command will generate an Excel PivotTable in your browser.
When FORMAT EXL2K PIVOT is enabled, two
data streams are created:
- The first data
stream is the PivotTable file.
The PivotTable file (.xht) is
an HTML file with embedded XML. The HTML file contains all the information
that appears in your browser.
- The second
data stream is the PivotTable cache file (.xml).
The PivotTable
cache file is a metadata type of file. It contains all the fields specified
in the procedure and links internally to the PivotTable file. The
PivotTable cache file can contain data fields called CACHEFIELDS,
which populate the PivotTable toolbar, but do not initially appear
in the report. CACHEFIELDS can be dragged and dropped from the PivotTable
toolbar into the PivotTable when required for analysis.
For more information about PivotTables, see the Creating Reports With WebFOCUS Language manual.
x
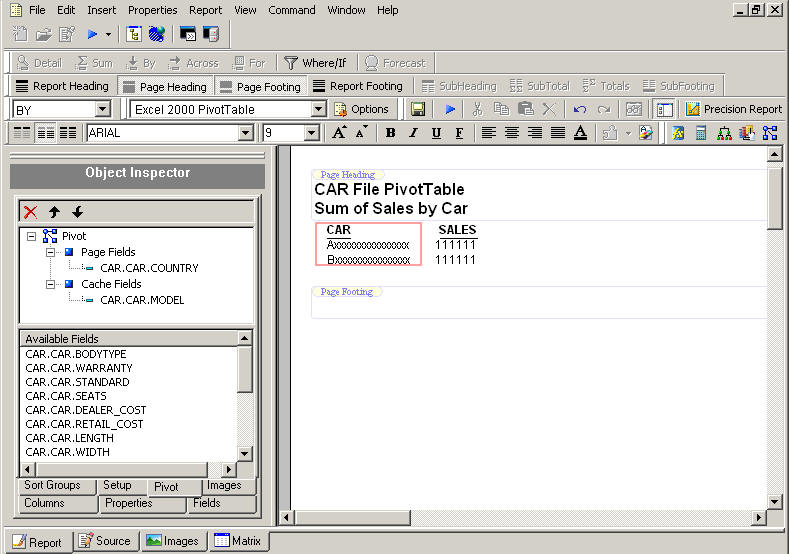
Procedure: How to Populate a PivotTable
The
following example illustrates how to generate a PivotTable:
-
After
selecting the Car data source to report against, open the Report
Painter.
-
In the
heading area, type CAR File PivotTable.
-
Press
the Enter key to add another line to the heading,
and type Sum of Sales by Car.
-
Move
the insertion point to the report and add the following fields from the
Object Inspector: SALES and CAR.
-
Select
the CAR column and click the By button.
Ensure that the SALES column is
a Detail field.
Note: The PRINT command must be used.
The PivotTable is generated by the PRINT command in combination
with the BY, ACROSS, PAGEFIELDS and CACHEFIELDS phrases. See Choosing a Display Format in the Creating Reports With WebFOCUS Language manual.
-
Select Excel
2000 PivotTable from the Output Format toolbar drop-down
list.
The Object Inspector opens at the Pivot tab and shows
the Available Fields list.
-
Click COUNTRY in
the Available Fields box and drag it to the Page Fields dimension
in the Pivot hierarchy.
-
Click MODEL in
the Available Fields box and drag it to the Cache Fields dimension
in the Pivot hierarchy.
-
Run
your report.
The
report displays the PivotTable in Excel 2000. All fields (including
PRINT, BY, and ACROSS fields, and PAGEFIELDS and CACHEFIELDS) appear
in the toolbar.
Note: Text
fields and Timestamp fields may not be used in Excel PivotTables. In
addition, ensure that there is no missing data for any fields.
xViewing a Report in Excel 97 Format
The EXL97 format allows you to view reports in Excel
97, which supports full styling and drill-down capability.
When you specify EXL97 format, an HTML-based file is generated
with an extension of .e97. The appropriate MIME type is automatically
assigned to designate Excel as the active application for this file
type.
When using the Microsoft Internet Explorer browser and Excel
97, the Excel client opens in the background and the report launches
in your browser. You may see the Excel application open and minimize
while viewing your report; leave Excel open when viewing the spreadsheet.
After the report is generated, you can save the document as an
Excel spreadsheet locally on your PC. In Excel 97, you will be prompted
to save the document as a Microsoft Excel Workbook with an .xls
extension. This will save the file as a binary Excel document.
For more information about Excel 97 format, see Choosing a Display Format in the Creating Reports With WebFOCUS Language manual.
Format EXL97 is fully compatible with Excel 2000 and Excel 2002.
Note: Although format EXL97 is available, there are some
limitations when compared to the Excel 2000 (EXL2K) format. See Limitations for FORMAT EXL97.
Future enhancements in the area of Excel integration will primarily
be made to the EXL2K format. We recommend upgrading to Excel 2000
or higher so you can take full advantage of our Excel integration,
as well as all future enhancements.
x
Procedure: How to View a Report in EXL97 Format
The
following example illustrates how a report appears in EXL97 Format.
-
After
selecting the Centord data source to report against, open the Report
Painter.
-
In the
heading area, type Plant Revenue in Excel 97 Format.
-
Move
the insertion point to the report and add the following fields from the
Object Inspector: PLANTLNG and LINEPRICE.
-
Select
the Line Total column in the Report Painter
window and click the Sum button.
-
Select
the PLANTLNG column and click the By button.
-
Select Excel
97 from the Output Format toolbar drop-down list.
-
Run
your report. The output is:
x
Reference: Limitations for FORMAT EXL97