In this section: How to: |
Hierarchical relationships between fields can be defined in a Master File and automatically displayed using the Financial Report Painter. The parent and child fields must share data values and their relationship should be hierarchical. For example, suppose that:
or
By examining these fields, it is possible to construct the entire organization chart or charts of accounts structure. However, to display the chart in a traditional row-based financial report, you would have to list the employee IDs or account numbers in the request in the order in which they should appear on the report. If an employee or account is added, removed, or transferred, you would have to change the report request to reflect this change in organizational structure.
In contrast, with FML hierarchies you can define the hierarchical relationship between two fields in the Master File and load this information into memory. The report request can then dynamically construct the rows that represent this relationship and display them in the report, starting at any point in the hierarchy.
For related information, see Requirements for FML Hierarchies.
Tip: You can construct the Master File using a text editor or the Synonym Editor.
For details, see Describing Data for an FML Hierarchy.
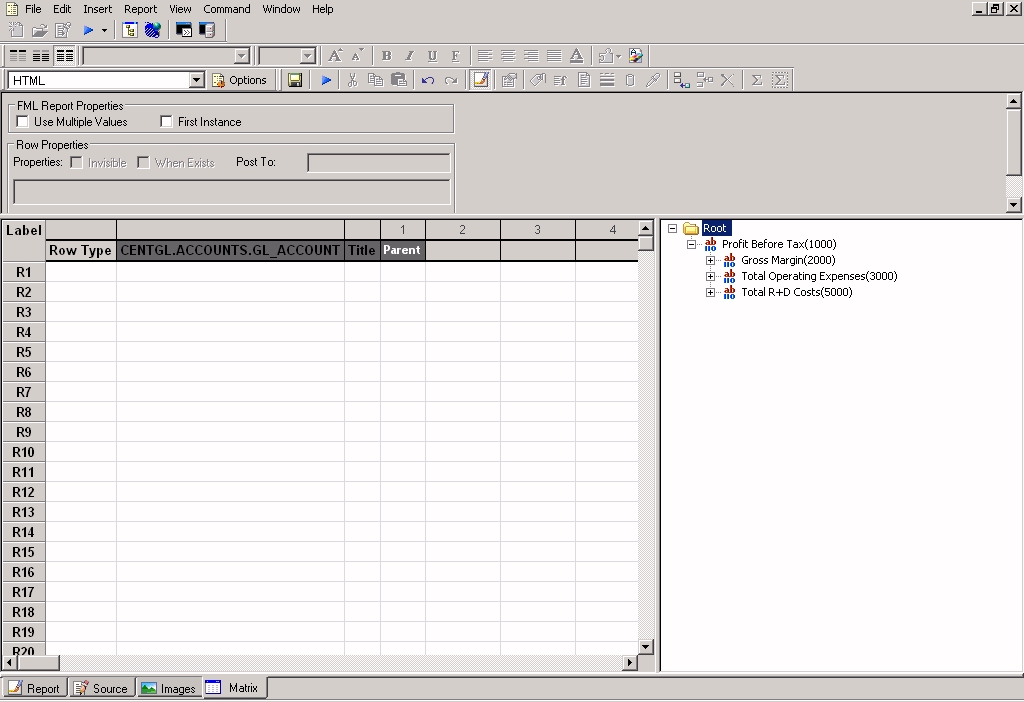
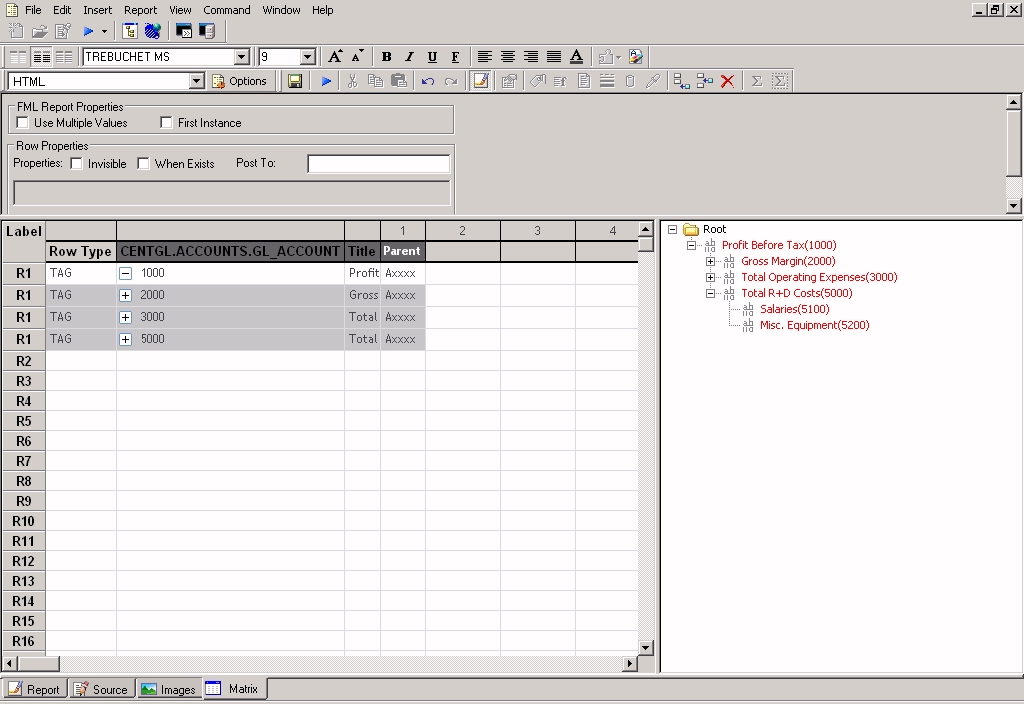
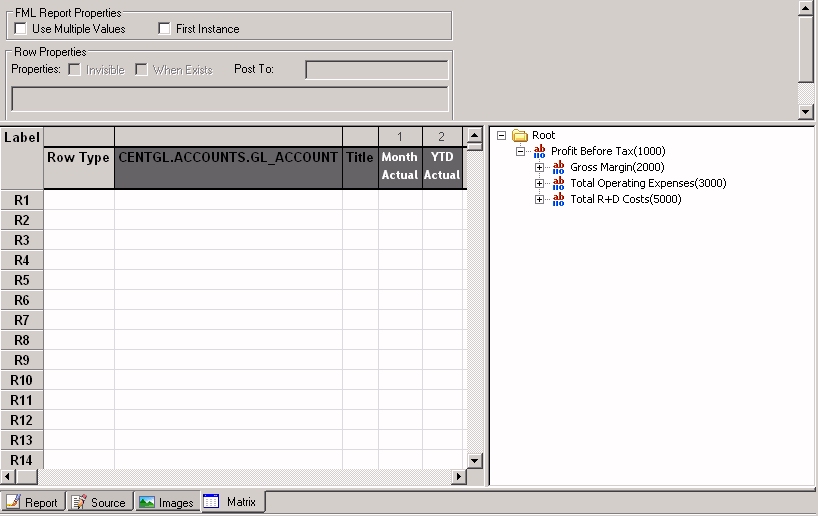
In the Financial Report Painter, the hierarchy defined in the Master File is reflected in the FOR field values panel to the right of the Design matrix, as shown in the following illustration. If the hierarchy fields are defined with captions in the Master File, the resulting report indents the captions proportionate to their levels in the hierarchy.
For details about how the parent/child hierarchy is represented in the Master File, see Describing Data for an FML Hierarchy.
Note: The ability to define a hierarchy in a Master File is particularly useful when you are working with a cube data structure, such as ESSBASE. However, it can be employed with other data source types.
In the Design matrix:
Note: To be able to use the same value in more than one row of the matrix, click the Use Multiple Values check box in the FML Report Properties area above the matrix.
or
Right-click anywhere in the row (except on the label) and select Change Type to, and then Tag from the context menu.
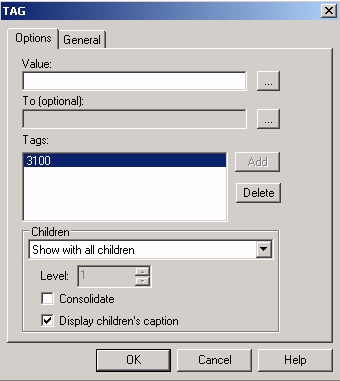
The TAG dialog box opens at the Options tab. (Note that when a hierarchy has been defined in the Master File against which you are reporting, a group of specialized options, described in steps 6-8, are included in the TAG dialog box.)
Displays a single summary row for the numeric data values of all children.
Displays the hierarchy starting with the first child of the specified parent, up to 99 levels deep. Each child instance appears over the next child instance. The parent level is not included in the output.
Successive levels of the hierarchy field are indented two spaces from the previous level. You can change the spacing of these indents. See How to Adjust Indents for Captions in a Hierarchy.
Displays children up to the level you indicate. The default value is 1. Therefore, if n is omitted, direct children appear. Level 2 retrieves direct children and grandchildren. The parent level is not included in the output.
Displays the hierarchy starting with the specified parent. (Level 99 is equivalent to ALL.) The parent level is included in the output.
Displays the values for the specified parent tag and its children, up to 99 levels deep. The default value is 1. Therefore, if n is omitted, direct children appear. The parent level is including in the output.
To supply an explicit row label to replace the default label (R1, and so on.) in the matrix, type it into the Label input box. (The default label is retained internally.)
The same label applies to the parent level and all child levels.
For details, see Suppressing the Display of Rows and Saving and Retrieving Intermediate Report Results.
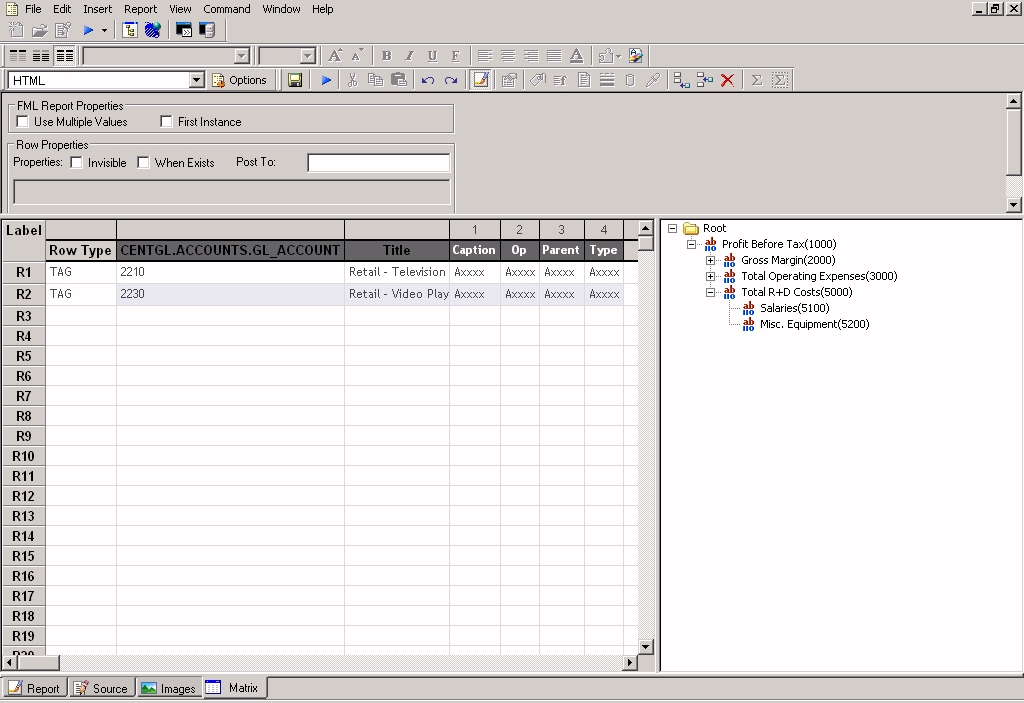
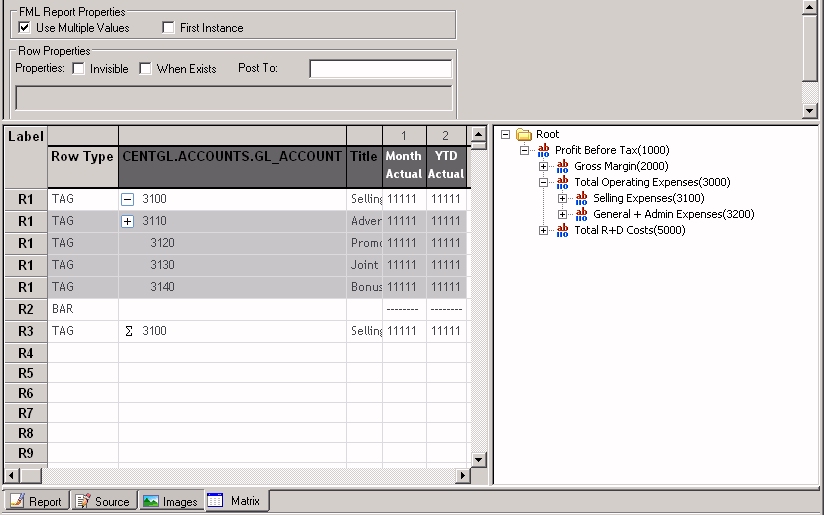
The matrix shows TAG in the Row Type column for the parent values. Each parent value for children that has been retrieved is preceded by a plus sign (+) that you can click to display the children. The plus sign (+) becomes a minus sign (-) that you can click to roll up the child values.
If you entered an explicit label in the Label input box, this element will appear in the matrix.
If you selected the Use Multiple Values check box in the FML Report Properties area above the matrix, the used value remains available in the FOR field values panel. It appears in red to indicate that it has already been added to the matrix.
Tip: You can also drag (or double-click) a tag from the FOR field values panel to a desired location on the matrix, then right-click in the TAG row and select Row Properties to open the TAG dialog box.
To clarify relationships within a hierarchy, the captions (titles) of values are indented at each level. To adjust the indents:
If a hierarchy has not been defined in the Master File for the data you are reporting against, the Indent option does not appear.
When reporting from an FML hierarchy, you can dynamically retrieve and display hierarchical data using two variations:
In either case, you can show all children for the specified parent, or children to a specified level in the hierarchy, up to 99 levels deep. The default hierarchy depth is one level. To highlight these relationships visually, successive levels of the hierarchy field are indented two spaces from the previous level. (You can change the indentations. See How to Adjust Indents for Captions in a Hierarchy.)
The hierarchy appears sorted by the parent field and, within parent, sorted by the hierarchy field.
When displaying a hierarchy, you can show either detail or summary data for fields other than the For field in the request. You can also replace the For field value with a descriptive caption.
The following example displays two levels of a charts of accounts hierarchy and shows descriptive captions defined in the Master File, instead of the account numbers, in the report.
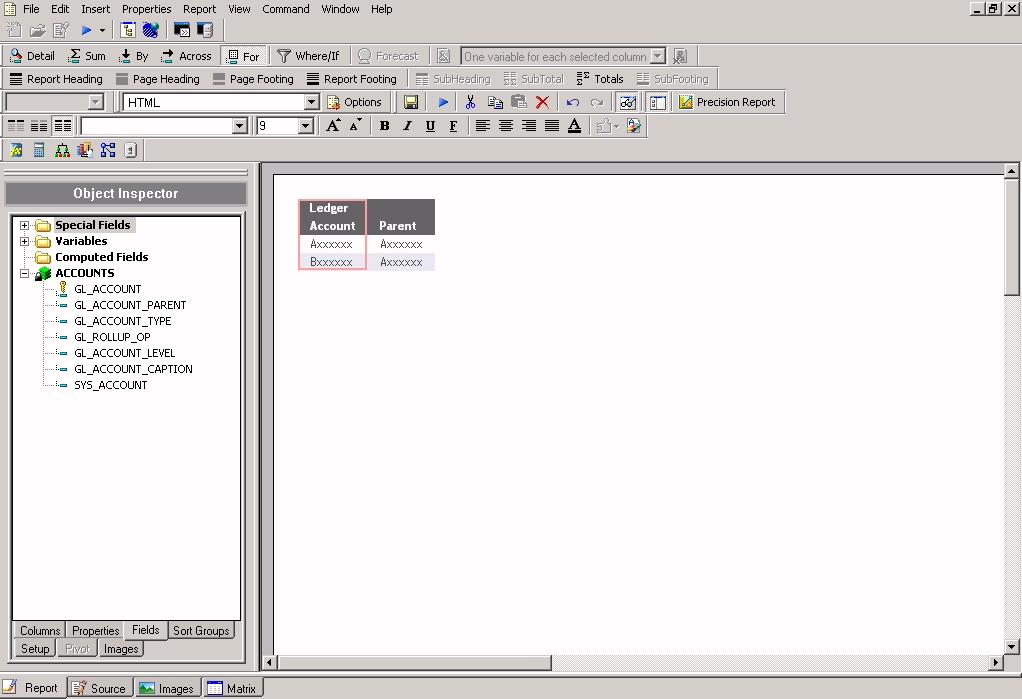
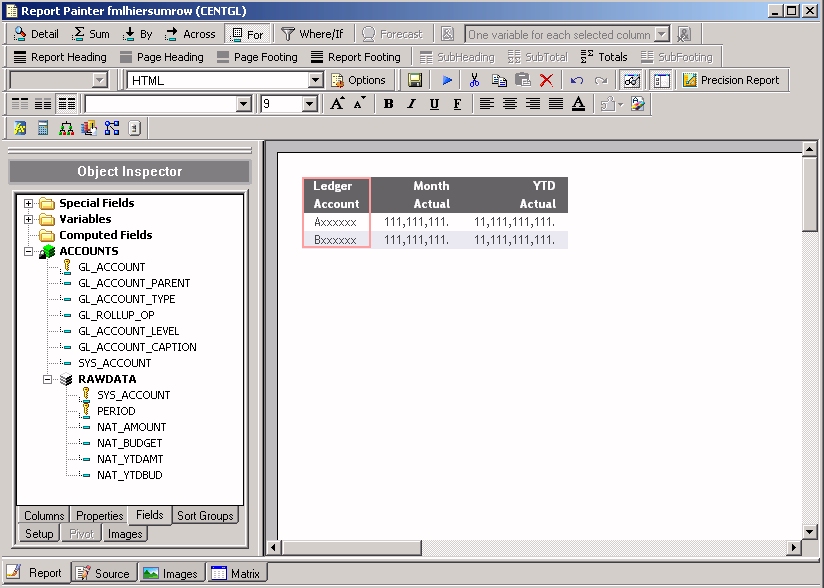
The Report Painter opens with CENTGL fields listed in the Object Inspector panel.
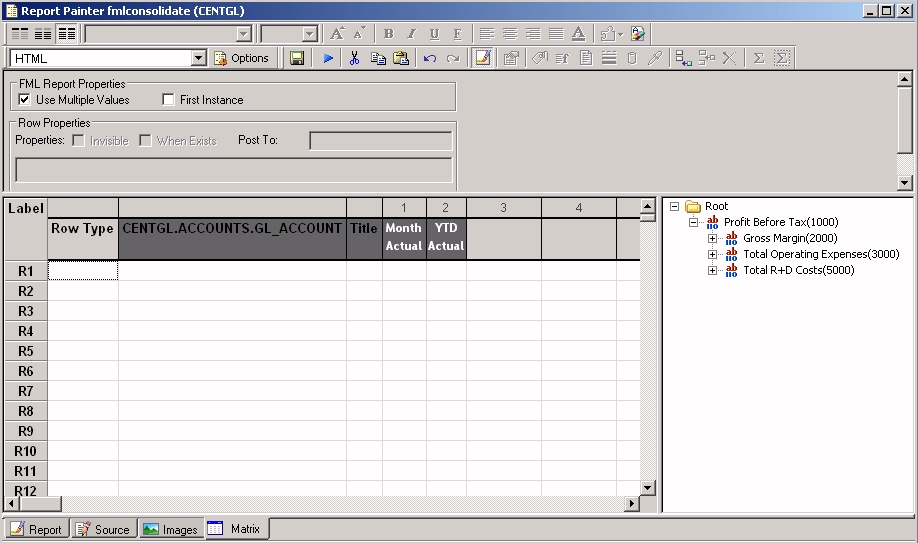
The Report Painter appears as shown in the following image.
The dialog box appears as shown in the following image.
The matrix appears as shown in the following image.
If you want to expand the hierarchy another level, repeat the process.
The selected StyleSheet is added to the Include StyleSheet File section.
The StyleSheet is applied to the report.
Tip: If you want to see the children in the hierarchy without the parent, choose Show only children to level 2 in step 8, rather than Show with children to level 2. Without the parent line, the report would look like the following image.
How to: Reference: |
The Consolidate option consolidates multiple levels of the hierarchy on one line of the report output. Consolidate can be used alone or in conjunction with the Show only children or Show with children options. Consolidation is designed to work with requests that use the Sum option for fields other than the For field. It is also designed to be used with detail level financial data, not data that is already consolidated.
In order to use a data record in more than one line of a financial report (for example, to display both detail and summary lines or to consolidate detail data at multiple levels), select the option,Use Multiple Values before you begin to populate the matrix.
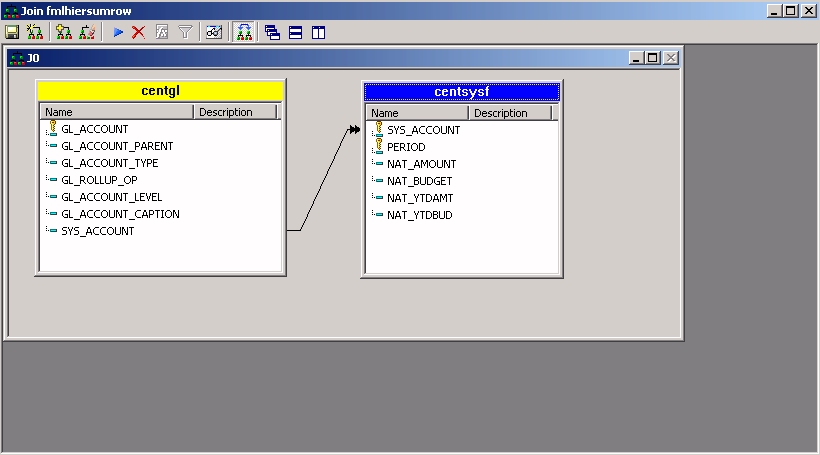
Data Detour: For this example, you will use two data sources: CENTGL and CENTSYSF. CENTSYSF contains detail level financial data. CENTGL defines the account hierarchy. To use the financial data with the account hierarchy, you must join the two data sources.
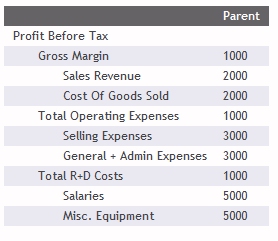
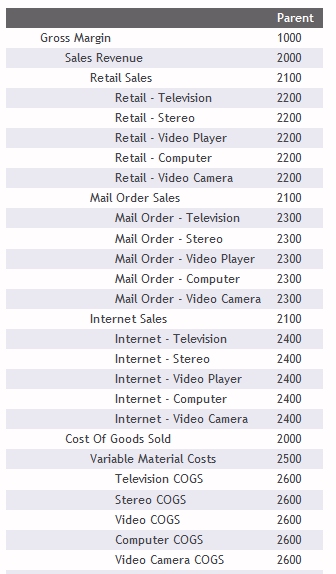
Before you complete this example, examine the data you will be using. While you can follow the flow of this example without looking at the data, doing so will help you understand the process and the output more fully. See Sample Data for FML Hierarchy Examples.
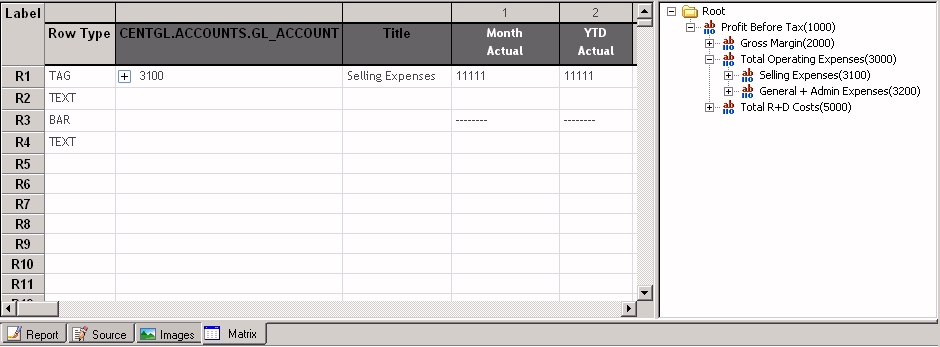
The Report Painter appears as shown in the following image.
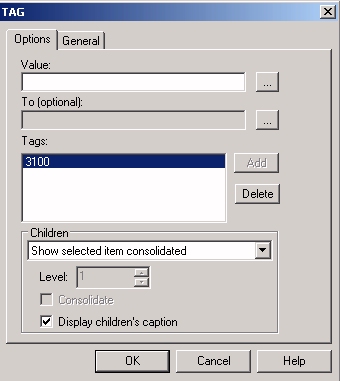
The TAG dialog box opens, with 3100 in the Tags list.
This will generate detail data for the parent value (3100) and all of its children, represented on the report by their descriptive captions rather than their account numbers.
The matrix appears as shown in the following image.
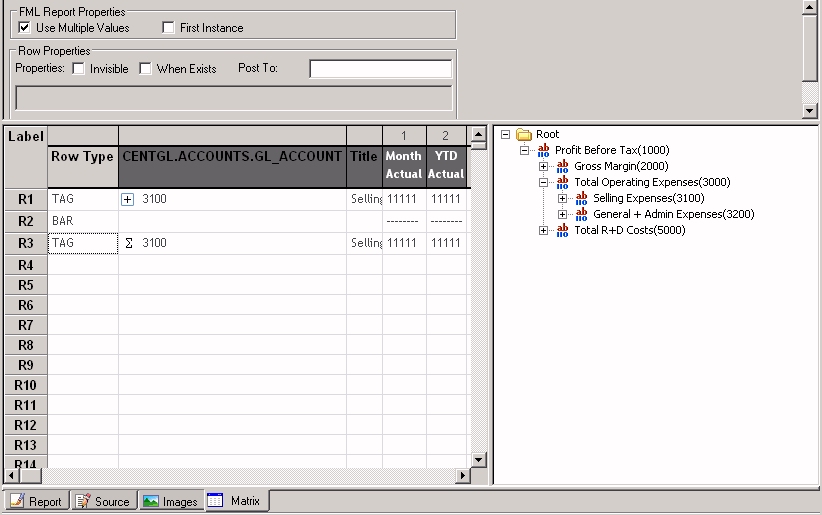
Notice that Advertising has its own children, while the other children of Selling Expenses do not. Notice also that the consolidated row, R3, has no plus sign (+) or hierarchy to expand.
The selected StyleSheet is added to the Include StyleSheet File section.
The StyleSheet is applied to the report.
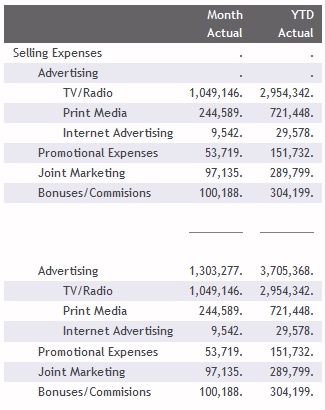
Note that only accounts with no children are populated in the detail level data source (CENTSYF), therefore, no values appear for Selling Expenses and Advertising. The consolidation row accurately sums the detailed data.
Tip: To display the sum of just the children, you must display the parent row, display the summary row, and use a RECAP to subtract the parent row from the sum. For example:
RECAP CHILDSUM = R2-R1;
The following procedure is an example of how to consolidate FML hierarchy data.
Tip: Rather than starting from scratch, you can open the matrix created in Displaying One Summary Line for an FML Hierarchy, delete the content of the matrix, and then complete the steps that follow.
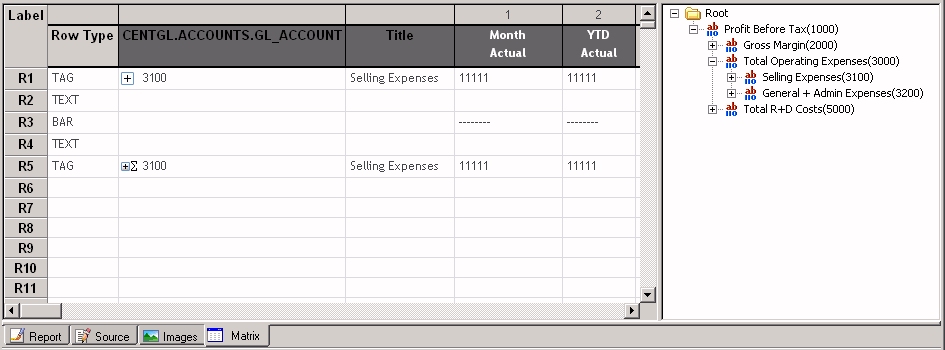
Drag 3100 onto the matrix in row R1. Right-click on 3100 and select Row Properties. The TAG dialog box opens, with 3100 in the Tags list.
The matrix appears as shown in the following image.
The matrix appears as follows as shown in the following image.
PERIOD EQ '2002/03'
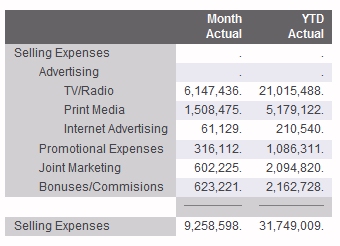
The output looks like the following image.
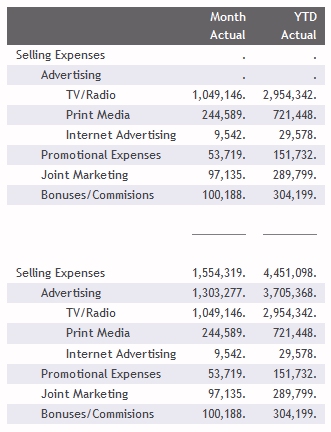
The top portion shows the detail level data.
The bottom portion shows the consolidated data. In the consolidated portion of the report:
Tip: If you wanted to see the children in the hierarchy without the parent, you could choose Show only children, rather than Show with children. Without the parent line the report would output as shown in the following image.
What makes this reporting dynamic?
Suppose that you run this report weekly. If you ran the report today, and tomorrow another account were added as a child of 3100, the report for next week would automatically reflect the change in the hierarchy, as well as changes to the data, based on the versatile parent/child declaration in the Master File. No adjustment would be needed to keep either the Master File or the report request up to date.
The CENTGL Master File contains a charts of accounts hierarchy. The field GL_ACCOUNT_PARENT is the parent field in the hierarchy. The field GL_ACCOUNT is the hierarchy field. The field GL_ACCOUNT_CAPTION can be used as the descriptive caption for the hierarchy field:
FILE=CENTGL       ,SUFFIX=FOC
SEGNAME=ACCOUNTS   ,SEGTYPE=S01
FIELDNAME=GL_ACCOUNT,           ALIAS=GLACCT,  FORMAT=A7,
            TITLE='Ledger,Account', FIELDTYPE=I, $
FIELDNAME=GL_ACCOUNT_PARENT,    ALIAS=GLPAR,   FORMAT=A7,
            TITLE=Parent,
            PROPERTY=PARENT_OF, REFERENCE=GL_ACCOUNT, $
FIELDNAME=GL_ACCOUNT_TYPE,      ALIAS=GLTYPE,  FORMAT=A1,
            TITLE=Type,$
FIELDNAME=GL_ROLLUP_OP,         ALIAS=GLROLL,  FORMAT=A1,
            TITLE=Op, $
FIELDNAME=GL_ACCOUNT_LEVEL,     ALIAS=GLLEVEL, FORMAT=I3,
            TITLE=Lev, $
FIELDNAME=GL_ACCOUNT_CAPTION,   ALIAS=GLCAP,  FORMAT=A30,
            TITLE=Caption,
            PROPERTY=CAPTION, REFERENCE=GL_ACCOUNT, $
FIELDNAME=SYS_ACCOUNT,          ALIAS=ALINE,   FORMAT=A6,
            TITLE='System,Account,Line', MISSING=ON, $
The CENTSYSF data source contains detail-level financial data. This is unconsolidated financial data for a fictional company, CenturyCorp. It is designed to be separate from the CENTGL database as if it came from an external accounting system. It uses a different account line system (SYS_ACCOUNT) which can be joined to the SYS_ACCOUNT field in CENTGL. Data uses "natural" signs (expenses are positive, revenue negative).
FILE=CENTSYSF     ,SUFFIX=FOC
SEGNAME=RAWDATA   ,SEGTYPE=S2
FIELDNAME = SYS_ACCOUNT   ,  ,A6       , FIELDTYPE=I,
            TITLE='System,Account,Line', $
FIELDNAME = PERIOD        ,  ,YYM      , FIELDTYPE=I,$
FIELDNAME = NAT_AMOUNT    ,  ,D10.0    , TITLE='Month,Actual', $
FIELDNAME = NAT_BUDGET    ,  ,D10.0    , TITLE='Month,Budget', $
FIELDNAME = NAT_YTDAMT    ,  ,D12.0    , TITLE='YTD,Actual', $
FIELDNAME = NAT_YTDBUD    ,  ,D12.0    , TITLE='YTD,Budget', $
You can create an FML hierarchy in a Master File using a text editor or the Synonym Editor. For details, see Describing Data for an FML Hierarchy.
| WebFOCUS |