Tracing WebFOCUS Processing
Traces can be generated and viewed in the WebFOCUS Administration Console for
the Servlet implementation of the WebFOCUS Client. Each of these traces
can be turned on and off on its trace page.
Note: Only administrators can enable
traces.
Tracing is only recommended for troubleshooting as it affects
performance. When you are confident that you have configured WebFOCUS properly, turn traces off and reload your Web application.
To access the trace files, click Diagnostics.
You can select any trace listed under the Traces menu:
- To view a trace
file, click the name of the trace file.
- To delete a
trace file, select the file by clicking the check box next to the
file name and click Delete. You can select
all trace files by clicking Select All, or
deselect all trace files by clicking Deselect All.
- To open a new
trace file at any point, click Refresh.
The initial location for all traces is install_dir:/ibi/WebFOCUS/logs.
You can change the location of trace files by specifying a new location
in the TRACE_LOCATION setting under the Startup Parameters menu.
If a trace location is not specified, the trace files are written
to install_dir:\ibi\WebFOCUS77\client\wfc\web\cgi.
x
Selecting
the All Clients trace option, rather than one particular trace,
displays a list of all trace files for all activated traces.
x
Reference: Advanced Web Tools Log
All
activities from the Advanced Graph Assistant,
Power Painter, and InfoAssist tools are tracked and appended to the log file named
advwebtools.log, which is located in drive:/ibi/WebFOCUS/logs.
The following trace levels are available:
-
OFF. No
activity from the Advanced Graph Assistant,
Power Painter, and InfoAssist tools is written to the advwebtools.log file.
-
FATAL. Produces
minimum tracing.
-
ERROR. Logs
information only if an error occurs.
-
WARN. Captures
only warning messages.
-
INFO. Captures
only informational messages.
-
DEBUG. Produces
maximum tracing.
-
TRACE. Enables
tracing.
x
Reference: Client Connector Trace
This
traces client connections to the WebFOCUS Reporting
Server. The type of trace that appears (NGXXJ or JLINK) depends
on the IBI_EDACONNECTOR setting.
Trace file names
are of the following form:
sequencenumber_tracetype_Connector_date_time.trace
A
new sequence number is generated with every trace file that gets
created and helps determine the order of processing when reviewing
traces for more than one component.
The type of trace is
NGXXJ or JLINK.
The date and time portions specify the date
and time the file was created.
Important: This setting
updates the CONNECTOR_TRACE setting in the Startup Parameters section
of the Configuration menu of the WebFOCUS Administration
Console. However, setting TRACE=ON overrides the CONNECTOR_TRACE
setting. When TRACE=ON is set, the Client Connector trace information is
included within the trace file of the component (for example, WFServlet)
that uses the WebFOCUS API (WFAPI) to make use of the client connector.
x
All
Dashboard activities are tracked and appended to the log file named
dashboard.log, which is located in drive:/ibi/WebFOCUS/logs.
The log file contains the following information:
date time thread_number level userid location message
where:
- date
Is the date when the line of trace code is created. The format
is MM/DD/YYYY.
- time
Is the time when the particular trace code has been written
to the log file. The format is hh:mm:ss:nnn.
- thread_number
Is the number generated for each new task performed in the
servlet.
- level
Is the TRACE_LEVEL defined in the Servlet parameters. Valid
values are OFF, FATAL, ERROR, WARN, INFO, DEBUG, and TRACE. TRACE
turns on tracing, OFF turns off tracing, FATAL produces minimum
tracing, ERROR logs information only if an error occurs and is the
default value, WARN captures only warning messages, INFO captures only
informational messages, and DEBUG produces maximum tracing.
- userid
Is the ID of the user who is accessing Dashboard.
- location
Is the internal location called by Dashboard. The format
is:
Java class name.Java method name.
- message
Is the internal trace text.
Note: A
daily backup of the dashboard.log file is created automatically.
The name of the backup log file is dashboard.log.yyyy-mm-dd. This
file can be deleted from within the WebFOCUS Administration Console.
x
Reference: Geographic Information Systems Trace
The
Geographic Information Systems (GIS) trace shows the steps taken
in processing requests to draw maps or run reports.
Level
1 gives the least detail, level 4 the most. It is recommended to
always use level 4.
The trace provides the following information:
- ArcXML query
requests from ArcIMS
- ArcXML map
drawing requests
- ArcXML responses
-
WebFOCUS code to
invoke FOCEXEC procedures
-
WebFOCUS report responses
-
WebFOCUS XML responses to be used
to draw maps
x
Information
about server side graphics (SSG) is available using the Graph trace
option under the Diagnostics menu in the WebFOCUS Administration
Console. The information that is displayed depends on whether SSG_EXTERNAL=YES
(process-based) or SSG_EXTERNAL=NO (thread-based).
When SSG_ENABLE=YES and SSG_EXTERNAL=YES (these
settings are accessible in the Graph section of the Configuration
menu), WFServlet launches a new java process to invoke the graph
engine. SSG_EXTERNAL=YES always requires start up time since it
parses all the graph properties when the Graph Engine is loaded.
If tracing is enabled and you execute a graph request, three trace
files are displayed in the following format:
-
sequence number_SSGexternal_date_time.trace -
Provides all the trace information related to the execution of the
graph request. This includes release number, parsing information,
and API calls sent to the graph engine.
-
sequence number_SSGexternal_ERROR_date_time.trace -
Provides information about any errors that occur during separate JVM
processes.
-
sequence number_SSGexternal_OUTPUT_date_time.trace -
Provides information about several JVM processes.
When SSG_ENABLE=YES and SSG_EXTERNAL=NO,
a single trace file is displayed in the following format:
sequence number_graph_date_time.trace -
Similar to sequence number_SSGexternal_date_time.trace,
this trace file provides all the trace information related to the
execution of the graph request.
Note: When SSG_ENABLE=NO,
no trace files are created since applet graphs are executed in the
browser rather than created on the application server.
x
Reference: HTML Tools Trace
The
HTML Tools trace provides information about the JavaBeans used by
the Report Assistant and the Graph Assistant. The Report Assistant
is an HTML-based reporting tool that allows you to select a data
source, specify sorting or grouping information, and display the
report in your browser or another desktop application. The Graph
Assistant is an HTML-based graphical tool that enables you to create
a graphical representation of your data. The Graph Assistant is
accessible through Dashboard and Managed
Reporting.
x
Reference: HTTP Trace for Tools
It
provides tracing of all HTTP calls and parameters for each JSP call.
x
Reference: MR Administration Trace
This
traces all activity in the MR Administration Interface, for example,
creating a user, assigning roles, adding the user to a group, and
so on.
Trace
file names are of the following form:
sequencenumber_MRA_WFAPI_date_time.trace
A new
sequence number is generated with every trace file that gets created. The
date and time portions specify the date and time the file was created.
x
Reference: MR Applet Interface Trace
This
logs all activity in the MR Applet Interface, for example, adding
a domain, creating and running a procedure, and so on.
MR Applet Interface log file names are of
the following form:
mr_userid_date.log
A
log file is created for each user on a daily or hourly basis.
x
Reference: MR Deferred Ticket Cleanup Utility Trace
You
can view log and trace file information for the MR Deferred Ticket
Cleanup Utility in the WebFOCUS Administration
Console.
Note: For
information about the MR Deferred Ticket Cleanup Utility, see the Managing
Deferred Tickets chapter in the WebFOCUS Managed Reporting Administrator's Manual.
MR Deferred Ticket Cleanup Utility Log File
The MR Deferred Ticket Cleanup Utility
creates a log file each time the utility is executed. Log files
can be viewed by clicking the MR Deferred Ticket Cleanup Utility option
on the Traces menu under the Diagnostics section of the WebFOCUS Administration Console.
The
file name of the log file is in the following form:
mrdtcleanup_date_time.log
where:
- date
Is the date the log file was created in Year Month Day (YYYY-MM-DD) format.
- time
Is the time the log file was created in Hour Minute Second
(HMS) format.
For example, a log file
created on Friday, August 18, 2006 2:46:52 PM appears as mrdtcleanup_060818_144354.log,
as shown in the following image.
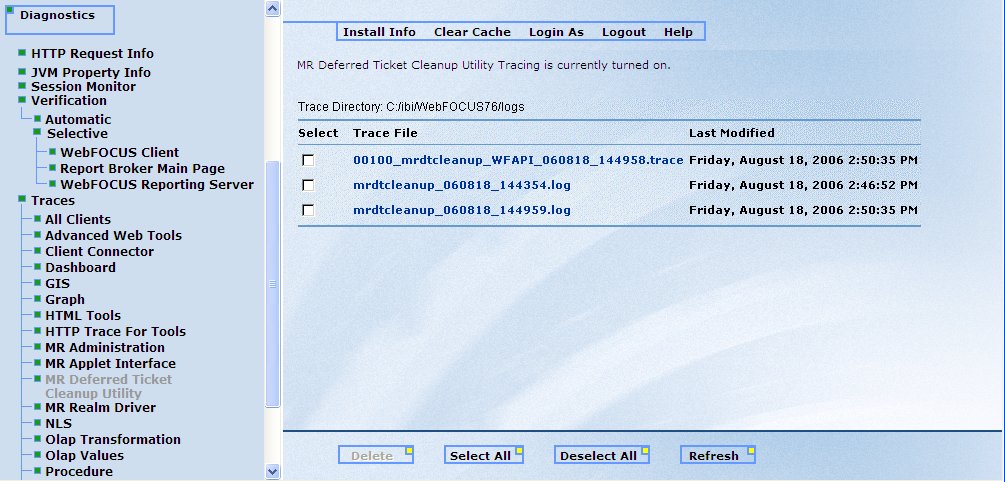
Click
the link, for example mrdtcleanup_060818_144354.log, to
display the log file information. To delete the log file, select
the check box next to the log file and click Delete.
You can also use the Select All and Deselect All options as needed,
or click the Refresh option to ensure that
the latest information appears in the console.
MR Deferred Ticket Cleanup Utility Trace File
To view trace file information for the
MR Deferred Ticket Cleanup Utility in the WebFOCUS Administration
Console, you must first turn tracing on for the WFServlet trace
option (this is turned off by default). With WFServlet tracing turned
on, upon running the MR Deferred Ticket Cleanup Utility, you can
view the resulting trace files by clicking the MR Deferred
Ticket Cleanup Utility option on the Traces menu under
the Diagnostics section of the console. A trace file is created
each time the utility is executed.
The file name of the trace
file is in the following form:
00100_mrdtcleanup_WFAPI_date_time.trace
where:
- date
Is the date the trace file was created in Year Month Day
(YYYY-MM-DD) format.
- time
Is the time the trace file was created in Hour Minute Second
(HMS) format.
For example, a trace file
created on Friday, August 18, 2006 2:50:35 PM appears as 00100_mrdtcleanup_WFAPI_060818_144958.trace,
as shown in the following image.
Click
the link, for example 00100_mrdtcleanup_WFAPI_060818_144958.trace,
to display the trace file information. To delete the trace file,
select the check box next to the trace file and click Delete.
You can also use the Select All and Deselect All options as needed,
or click the Refresh option to ensure that the latest information
appears in the console.
x
Reference: MR Realm Driver Trace
This
traces external authentication and external authorization when the
MR Realm Driver is configured.
Tracing is
only recommended for troubleshooting as it affects performance.
When you are confident that the Realm Driver is configured properly,
turn traces off and reload your Web application.
Trace files
are created in the log directory with names of the form mrrealm_yymmdd_hhmmss.log.
The Realm Driver log service writes useful troubleshooting messages
to the file. It appends new messages to the existing information in
the file.
x
Turning
NLS traces ON through the WebFOCUS Administration
Console displays the following information:
- System Locale
(Language and Country values) from the Web server machine.
- CGI Encoding
code page number being used.
- JSP Initialization
method used and NLS error message from Java when any of the HTML
tools are launched.
x
Reference: OLAP Transformations Trace
The
OLAP Transformation trace provides the content sent from the browser
to the WebFOCUS Client, such as the query and resulting answer set.
x
Reference: OLAP Values Trace
It
provides similar information in the OLAP Transformation trace and
is used to track the query when the user requests data values from
the OLAP Pane or OLAP control panel to do record selection.
x
Reference: Procedure Trace
These
traces enable you to see the syntax that was sent to the WebFOCUS Reporting Server for processing.
When procedure traces are enabled, the PROCEDURE_LOG setting in
the Startup Parameters section of the WebFOCUS Administration
Console is automatically set to on.
The
trace file name format is as follows:
procedure_subcomponent_date_time.log
The
subcomponent is the component used to make the request at the time
the log was generated. The date and time specify the date and time
the file was created.
Information is appended to the log on
a daily basis.
x
The
Monitor Log options provides information about one or more active
sessions. Logging is enabled using the Session Monitor option
under the Diagnostics menu for all sessions
or for each individual session. The Monitor log provides the following
levels of diagnostics information:
-
OFF. No information
is written to the monitor.log file.
-
FATAL. Produces
minimum tracing.
-
ERROR. Logs
information only if an error occurs.
-
WARN. Captures
only warning messages.
-
INFO. Captures
only informational messages.
-
DEBUG. Produces
maximum tracing.
-
TRACE. Enables
tracing.
The information that is written to the
log file is based on the log level that is set. For example, the
INFO log level provides the following information in the log:
[2010-01-07 16:29:14,235] INFO ReqEnd MonID=12150b6mc7uzf ClientUser=admin ReqID=16.29.03.987-1
Node=EDASERVE ServerUser= Completed=16.29.14.234 TimeUsed=10247 ReqInfo=Run:App=IBISAMP:Fex=ADHOCRQ
where:
- MonID
-
Is a unique identifier for each session.
- Client User
-
Is the WebFOCUS user ID that
is running the request.
- ReqID
-
Is a unique request identifier for the WebFOCUS Reporting Server.
- Node
-
Is the name of the WebFOCUS Reporting
Server that is running the request.
- Server User
-
Is the WebFOCUS Reporting
Server user ID.
- Completed
-
Is the time, in milliseconds, in which the request was complete.
- TimeUsed
-
Is the length of time, in milliseconds, that it took to run
the request.
- ReqInfo
-
Provides information about the request, such as the application
name and the report procedure name.
x
Reference: Web Services Trace
WebFOCUS Web Services allow you to
develop applications in the .NET or Java environments and perform WebFOCUS functionality from those environments.
Each
trace file is a separate Web Service function call which traces
the SOAP messages. This is important when programmers want to debug
their .NET or Java programs when calling WebFOCUS Web
Service functions.
x
Reference: WFServlet Trace
This
trace tracks requests processed by the WFServlet implementation
of the WebFOCUS Client. The trace file name is of the form:
sequencenumber_WFServlet_WFAPI_date_time.trace
A
new sequence number is generated with every trace file that gets
created. The date and time portions specify the date and time the
file was created.