Creating an Active Technologies Chart

In this section:

How to:

You can use standard WebFOCUS GRAPH FILE syntax to create an active chart. The GRAPH FILE syntax supports the following types of active charts:

In the GRAPH FILE procedure, you can apply one of three output formats to the chart:

The following guidelines apply.


Top of page

x
Syntax: How to Create an Active Technologies Chart With WebFOCUS Syntax

To create an active chart, use

ON GRAPH {PCHOLD|HOLD|SAVE} FORMAT {AHTML|FLEX|APDF}

where:

PCHOLD

Displays the chart output in a Web browser in the format specified. PCHOLD is the default value.

HOLD

Saves the chart output to a temporary file for later use. The output is saved with an associated Master File.

SAVE

Saves the chart output to a file for later use, but the output is not saved with a Master File.

AHTML

Creates an HTML version of the chart.

FLEX

Creates an Adobe Flash Player version of the chart (Adobe Flash file).

APDF

Creates an Adobe Flash Player version of the chart (Adobe Flash file), embedded in a PDF file.


Example: Creating an Active Technologies Chart in FLEX Format

The following WebFOCUS code creates an Adobe Flash Player version of an active chart.

The code that controls the chart type (PIE) and the code that controls the output format (FLEX) is shown in bold.

The WebFOCUS StyleSheet code, which follows the code shown in bold, controls the way that the legend is displayed in the output. In this example, the legend is fixed. It appears underneath the chart. For more information on controlling the legend, see Controlling the Legend of an Active Technologies Chart in FLEX or APDF Format.

GRAPH FILE GGSALES
SUM DOLLARS
BY CATEGORY
BY PRODUCT 
ON GRAPH SET LOOKGRAPH PIE             
ON GRAPH PCHOLD FORMAT FLEX 
ON GRAPH SET STYLE *
TYPE=REPORT, OBJECT=LEGEND, LEGEND-VIEW=FLAT,$
ENDSTYLE
END

The output is shown in the following image.

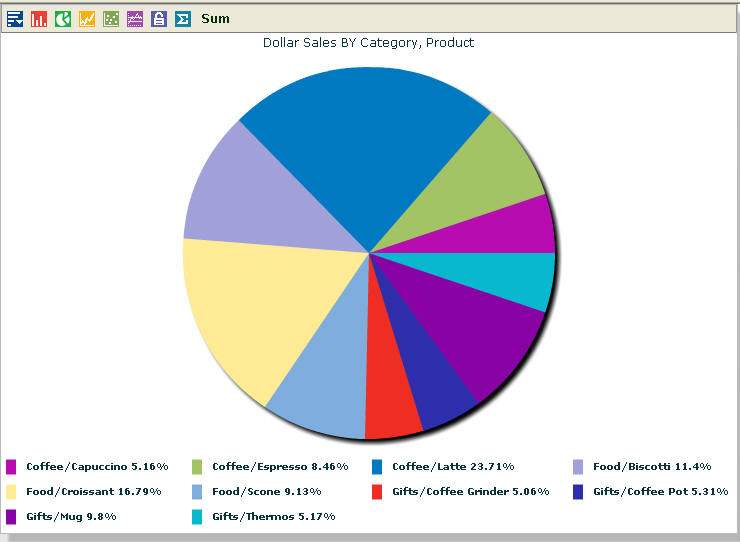
You can use the icons at the top of the chart as you do for charts that are generated by a graphical tool. For example, you can change the chart type from pie to bar.

The Chart Tool is accessible from the left-most icon at the top of the chart. The Chart Tool allows you to change the columns and switch the chart type.


Top of page

x
Controlling the Chart Type

How to:

You can control the chart type using the WebFOCUS code ON GRAPH SET LOOKGRAPH.


x
Syntax: How to Control the Chart Type

To create a vertical bar chart, use

ON GRAPH SET LOOKGRAPH BAR            

where:

BAR

Is the default value.

To create a vertical line chart, use:

ON GRAPH SET LOOKGRAPH LINE

To create a pie chart, use:

ON GRAPH SET LOOKGRAPH PIE

To create a scatter chart, use:

ON GRAPH SET LOOKGRAPH SCATTER

Top of page

x
Controlling the Legend of an Active Technologies Chart in FLEX or APDF Format

In this section:

How to:

You can control how to display the legend for an active chart in FLEX or APDF format, using WebFOCUS StyleSheet code. The legend can be fixed or collapsible.

A legend always appears on a pie chart. A legend appears on a bar, line, or scatter chart if the chart has more than one Y-axis field.


x
Syntax: How to Control the Legend of an Active Technologies Chart in FLEX or APDF Format

To display a fixed legend underneath the chart, use:

TYPE=REPORT, OBJECT=LEGEND, LEGEND-VIEW=FLAT,$

To display a collapsible legend at the position specified, use

TYPE=REPORT, OBJECT=LEGEND, LEGEND-VIEW=DOCKING,
POSITION-POINT={BOTTOM-LEFT|BOTTOM-CENTER|BOTTOM-RIGHT},$

where:

BOTTOM-LEFT

Is the default value.


Example: Displaying a Collapsible Legend

The following WebFOCUS StyleSheet code generates a collapsible legend at the bottom right of an active pie chart in FLEX format.

TYPE=REPORT, OBJECT=LEGEND, LEGEND-VIEW=DOCKING,
POSITION-POINT=BOTTOM-RIGHT,$

The output is shown in the following image. In the image, the cursor is pointing to the Legend icon at the bottom right of the chart.

Legend icon on pie chart

You can:


x
Additional Examples

The examples in this topic describe the supported chart legend syntax and the output that it generates.

GRAPH FILE vs. TABLE FILE

When you run a GRAPH FILE procedure to generate a chart, the output displays the chart toolbar above the chart. The result is the same when you run a TABLE FILE procedure with the initial report view set to a chart, using the following StyleSheet code:

TYPE=REPORT, REPORT-VIEW=CHART, CHART-TYPE=PIE,$

The chart that is generated runs inside a canvas frame, not inside a window or panel type of frame.

When you run a TABLE FILE procedure and you do not set the initial report view to a chart, WebFOCUS generates an active report that is in grid view. You can create a chart from a drop-down menu on the active report, using the Chart menu option. When you do that, the chart opens up inside a new window or panel type of frame. You can minimize, maximize, or close the window.

Examples


Top of page

x
Customizing Chart Colors and Styles for Active Technologies Reports and Dashboards

How to:

You may customize chart colors and styles for active reports and active dashboards by creating a JavaScript file to overwrite the default colors and styles used for charts. The customization steps vary, depending on the output format.

For all output formats, if these customized JavaScript files exist in your application folder, the default styles are overwritten by the colors and styles specified. You can have different customized JavaScript files in your application folder, enabling you to update the active reports and active dashboards in your existing applications with different styles and color themes to meet your needs.


x
Procedure: How to Customize Chart Colors for Active Technologies Reports and Dashboards in HTML

By creating the irpcusf.js JavaScript file, you may add JavaScript code to customize the colorTable RGB color codes for charts in active reports and active dashboards in HTML.

  1. Navigate to your application folder to create the JavaScript file.

    This should be the same directory as the location of the active report or active dashboard. For example, from the Projects area of Developer Studio, create a new JScript Script File in the Other subfolder of the project folder.

  2. Name the JavaScript file irpcusf.js in the File name field and click Open.
  3. Add the following JavaScript code:
    colorTable["ibi"]=[[0,121,193],[127,173,220],[84,12,182],
    [161,161,217],[46,46,171],[105,3,164],[9,184,206]];

    The numbers represent the array of colors for active chart series using colorTable RGB color codes. Enter the series color of your choice separated by commas, no spaces, and brackets.

  4. Save and close the JavaScript file.

    The next time you run an active report or active dashboard, the charts appear with the series colors you selected in the customized JavaScript file.

The following image shows an active dashboard, using the HTML output format, with customized chart colors.

Customized chart colors for Active Dashboard


x
Procedure: How to Customize Chart Styles for Active Technologies Reports and Dashboards for Adobe Flash Player and for PDF

By copying and pasting the irpfsty.js JavaScript file, you may edit JavaScript code to customize the Cascading Style Sheet syntax for charts in active reports and active dashboards for Adobe Flash Player and for PDF.

  1. Copy and paste irpfsty.js from the Reporting Server location (\home\etc directory) to your application folder.

    This should be the same directory as the location of the active report or active dashboard. For example, from the Projects on localhost area in Developer Studio, paste irpfsty.js in the Other subfolder of the project folder.

  2. Open the JavaScript file and apply different sets of colors to Pie, Bar, Line, and Scatter charts.

    Tip: Cascading Style Sheet syntax uses HTML color code or hex values for the colors. For details on each available property, see the Adobe documentation.

  3. For Pie Chart styles, you can modify properties for arPieSeries1 of arPieChartStyle.

    Currently, you may only modify the first series in a pie chart of the active report for Adobe Flash Player.

    .arPieChartStyle {
       chartSeriesStyles: arPieSeries1, arPieSeries2, arPieSeries3;
    }
    .arPieSeries1 {
    	fills: #35675B, #A4C366, #FFAC1B, #618466, #E4CDAD, #3f9f3f, #aca52d, #09cf6b, #d4dc7f, #B50CB1;
    	color: #408a1c;
    	fontWeight: bold;
    	labelPosition: outside;
    }

    where:

    fills

    A single array of colors to specify the individual color for each pie chart wedge.

    color

    The color of the text used in the chart, including the label.

    fontWeight

    Sets the text to be in boldface.

    labelPosition

    Specifies how to display data labels for the pie chart wedges. The default is none. The possible values are:

    • callout - displays labels with lines from each label to the associated wedge in two vertical stacks on either side of the Pie Chart. Note this shrinks the size of the Pie chart and labels if necessary to fit them in the space provided.
    • inside - displays labels inside the chart.
    • insideWithCallout - displays labels inside the pie chart, and converts them to callout labels if labels are shrunk below a legible size.
    • outside - displays labels outside the chart.
  4. For Bar Chart styles, you can modify each arBarSeries property of arBarChartStyle.

    You can add as many series as needed. The number of series specified in the array for arBarChartStyle has to correspond with the number of bar series defined.

    .arBarChartStyle{
     chartSeriesStyles: arBarSeries1, arBarSeries2, arBarSeries3, arBarSeries4,
       arBarSeries5, arBarSeries6, arBarSeries7, arBarSeries8, arBarSeries9, 
       arBarSeries10;
    }
    .arBarSeries1 {
    	fill: #35675B;
    }
    .arBarSeries2 {
    	fill: #A4C366;
    }
    .arBarSeries3 {
    	fill: #FFAC1B;
    }
    …
    }

    where:

    fill

    Sets the color for each series in a chart.

  5. For Line Chart styles, you can modify each arLineSeries property of arLineChartStyle.

    You can add as many series as needed. The number of series specified in the array for arLineChartStyle has to correspond with the number of line series defined.

    .arLineChartStyle{
    	chartSeriesStyles: arLineSeries1, arLineSeries2, arLineSeries3, arLineSeries4,
       arLineSeries5, arLineSeries6, arLineSeries7, arLineSeries8, arLineSeries9,
       arLineSeries10;
    }
    .arLineSeries1 {
    	form: curve;
    	color: #35675B;
    	weight: 2;
    }
    .arLineSeries2{
    	color: #A4C366;
    	weight: 2;
    }
    .arLineSeries3 {
    	color: #FFAC1B;
    	weight: 2;
    }
    …
    }

    where:

    form

    Sets the line type for the chart. The default is segment. Possible values are:

    • segment - draws angled lines to connect each data point in the series.
    • curve - draws curves between the data points.
    • horizontal - draws a horizontal line on each data point.
    • vertical - draws a vertical line on each data point. The length is determined from the y-coordinate of the first point to the y-coordinate of the second point.
    • step - draws a horizontal line at the first data point, then a vertical line to the second point, and repeats to create steps for each data point.
    • reverseStep - draws a vertical line at the first data point, then a horizontal line to the second point, and repeats to create reverse steps for each data point.
    color

    Sets the color of the line.

    weight

    Sets the width of the line in pixels. The default value is 0.

  6. For Scatter Chart styles, you can modify each arScatterSeries property of arScatterChartStyle.

    You can add as many series as needed. The number of series specified in the array for arScatterChartStyle has to correspond with the number of scatter chart series defined.

    .arScatterChartStyle{
    	chartSeriesStyles: arScatterSeries1, arScatterSeries2, arScatterSeries3,
       arScatterSeries4, arScatterSeries5, arScatterSeries6, arScatterSeries7,
       arScatterSeries8, arScatterSeries9, arScatterSeries10;
    }
    .arScatterSeries1 {
    	fill: #35675B;
    	radius: 8;
    }
    .arScatterSeries2 {
    	fill: #A4C366;
    }
    .arScatterSeries3 {
    	fill: #FFAC1B;
    }
    …
    }

    where:

    radius

    Sets the radius of the plot point in pixels. The default value is 5 pixels.

  7. You can also apply styles to the legend and change the background color of the Bar, Line, and Scatter chart.

    For example, the following syntax applies the alternate background color and changes the font color of the legend:

    Legend {
            color: #306814;
    }
    GridLines {
            horizontalAlternateFill: #e8f7e6;
            horizontalFill: #f5fbf1;
    }
  8. Moreover, when generating an active dashboard for Adobe Flash Player and for PDF, the dashboard is compiled with the native controls, namely, TabNavigator and ComboBox. You can create the StyleSheet for TabNavigator and ComboBox using Cascading Style Sheet syntax, and apply it to your active dashboard to style the dashboard further.

    For example, the following code applies the different colors and font styles to the tabs, pull down menu, and text in the dashboard:

    TabNavigator {
       backgroundColor: #d8fcb1;
       borderColor: #118822;
       color: #35675b;
       tabStyleName: "myTabs";
       firstTabStyleName: "myTabs";
       lastTabStyleName: "myTabs";
    }
    .myTabs {
       fillColors: #ffffff, #a6cdb1;
       borderColor: #118822;
       color: #35675b;
       textRollOverColor: #118822;
       themeColor: #35675b;
    }
    ComboBox {
       color: #35675b;
       borderColor: #118822;
       iconColor: #35675b;
       selectionColor: #2cd61c;
       textSelectedColor: #254941;
       rollOverColor: #9eefaa;
       textRollOverColor: #075812;
       themeColor: #35675b;
       dropdownStyleName: "myComboBoxDropDowns";
    }
    .myComboBoxDropDowns {
       borderColor: #118822;
       color: #35675b;
    }
    Text {
    	color: #35675b;
    	fontWeight: bold;
    }
  9. Save and close the JavaScript file.

    The next time you run an active report or active dashboard, the charts appear with the colors and styles you selected in the customized JavaScript file.

The following image shows an active dashboard for PDF with fully customized style.

Active Dashboard in Flash/Flex PDF with customized style.


Top of page

x
Customizing Chart Animation Effects for Active Technologies Reports and Dashboards

In this section:

How to:

Active Technologies for Adobe Flash Player allow you to customize how a chart is displayed on an active report or active dashboard. There are three separate animation effects that you can use: SeriesInterpolate, SeriesSlide, and SeriesZoom. You can control the properties of each effect to achieve a distinct impact.

All the styling options for the charts in Active Technologies for Adobe Flash Player are stored in the irpfsty.js file, found in the \home\etc directory of the WebFOCUS Reporting Server. You can copy this file to your application folder and edit the contents to customize the charts for your application.

The animation effects used in the charts are listed at the top of the irpfsty.js file, as shown here.

<mx:SeriesSlide id="lineShowEffect" duration="2000"/> 
<mx:SeriesSlide id="lineHideEffect" duration="2000"/>
<mx:SeriesSlide id="scatterShowEffect" duration="2000"/>
<mx:SeriesSlide id="scatterHideEffect" duration="2000"/>
<mx:SeriesInterpolate id="barShowEffect" duration="2000" elementOffset="10" />
<mx:SeriesSlide id="XbarShowEffect" direction="up" duration="2000"/>
<mx:SeriesSlide id="XbarHideEffect" direction="down" duration="2000"/>
<mx:SeriesInterpolate id="pieShowEffect" duration="2000" elementOffset="10" />
 

Active Technologies determine which effect to use by the id specified in this section.

For example, you can edit this section to change the bar chart effect to slide instead of interpolate by commenting out the existing barShowEffect element. You would set the id for SeriesSlide to “barShowEffect" and set the direction of the slide to "right," as shown in the following procedure.


x
Procedure: How to Customize Chart Animation Effects
  1. Copy and paste the irpfsty.js file from the WebFOCUS Reporting Server location (\home\etc directory) to your application folder.

    This should be the same directory as the location of the active report or active dashboard. For example, from the Projects on localhost area in Developer Studio, paste irpfsty.js in the Other subfolder of the project folder.

  2. Comment out the existing code for the type of chart whose effect you wish to change. For this procedure, you will change the effect of the bar chart from SeriesInterpolate to SeriesSlide. Comment out the following line of code for barShowEffect:
    <!-- <mx:SeriesInterpolate id="barShowEffect" duration="2000"
       elementOffset="10" /> -->
  3. Insert the following line of code for SeriesSlide:
    <mx:SeriesSlide id="barShowEffect" direction="right" duration="2000"/> 

    The code will look like the following:

    <!-- <mx:SeriesInterpolate id="barShowEffect" duration="2000"
       elementOffset="10" /> -->
    <mx:SeriesSlide id="barShowEffect" direction="right" duration="2000"/> 

    Tip: Adding <!-- at the beginning of the first XML tag and --> at the end of the closing XML tag comments out the entire section.

  4. Save and close the irpfsty.js file.
  5. Run the procedure. You will see each bar sliding in from left to right instead of moving up from bottom to top.


x
Using SeriesZoom

One of the effects that is not included in the irpfsty.js file is SeriesZoom.

In order to use this effect, you need to add it to the irpfsty.js file. You also need to include the datavisualization.swc file in your WebFOCUS Reporting Server \home\etc\flex\frameworks\libs folder. The datavisualization.swc file is found in your Adobe Flex Builder SDK directory, typically in \Program Files\Adobe\Adobe Flex Builder 3\sdks\3.5.0 (or 3.4.0)\frameworks\libs.

Then you can comment out the existing pieShowEffect element, and add the SeriesZoom effect as pieShowEffect, as shown in the following example.

<!-- <mxSeriesInterpolate id="pieShowEffect" duration="2000" elementOffset="10" /> -->
<mx:SeriesZoom id="pieShowEffect" duration="2000" elementOffset="-50" 
   minimumElementDuration="50" verticalFocus="top" horizontalFocus="right"
   relativeTo="chart" />

You can find more information on each effect and its properties in the Adobe documentation.


Top of page

x
Chart Type Syntax

Active Technologies support many types of active charts. Depending on the type that you are creating, you can:

This topic describes the CHART-TYPE syntax and the LOOKGRAPH syntax that you can use to create the available types of active charts.

Bar Chart Types

Type

LOOKGRAPH Syntax

CHART-TYPE Syntax

BAR

ON GRAPH SET 
LOOKGRAPH BAR 
TYPE=REPORT,REPORT-VIEW=FUSIONCHART,CHART-TYPE=MSBar3D,$ 
ON GRAPH SET 3D OFF 
TYPE=REPORT,REPORT-VIEW=FUSIONCHART,CHART-TYPE=MSBar2D,$ 

HBAR

ON GRAPH SET 
LOOKGRAPH HBAR 
TYPE=REPORT,REPORT-VIEW=FUSIONCHART,CHART-TYPE=MSBar3D,$ 
ON GRAPH SET 3D OFF 
TYPE=REPORT,REPORT-VIEW=FUSIONCHART,CHART-TYPE=MSBar2D,$ 

3DBAR

ON GRAPH SET 
LOOKGRAPH 3DBAR 
TYPE=REPORT,REPORT-VIEW=FUSIONCHART,CHART-TYPE=MSBar3D,$ 
ON GRAPH SET 3D OFF 
TYPE=REPORT,REPORT-VIEW=FUSIONCHART,CHART-TYPE=MSBar2D,$ 

NONE

ON GRAPH SET 
LOOKGRAPH NONE 
TYPE=REPORT,REPORT-VIEW=FUSIONCHART,CHART-TYPE=MSBar3D,$ 
ON GRAPH SET 3D OFF 
TYPE=REPORT,REPORT-VIEW=FUSIONCHART,CHART-TYPE=MSBar2D,$ 

CUSTOM

ON GRAPH SET 
LOOKGRAPH CUSTOM 
TYPE=REPORT,REPORT-VIEW=FUSIONCHART,CHART-TYPE=MSBar3D,$ 
ON GRAPH SET 3D OFF 
TYPE=REPORT,REPORT-VIEW=FUSIONCHART,CHART-TYPE=MSBar2D,$ 

HBAR2AX

ON GRAPH SET 
LOOKGRAPH HBAR2AX 
TYPE=REPORT,REPORT-VIEW=FUSIONCHART,CHART-TYPE=MSBar3D,$ 
ON GRAPH SET 3D OFF 
TYPE=REPORT,REPORT-VIEW=FUSIONCHART,CHART-TYPE=MSBar2D,$ 

HBAR2AXS

ON GRAPH SET 
LOOKGRAPH HBAR2AXS 
TYPE=REPORT,REPORT-VIEW=FUSIONCHART,CHART-TYPE=StackedBar3D,$ 
ON GRAPH SET 3D OFF 
TYPE=REPORT,REPORT-VIEW=FUSIONCHART,CHART-TYPE=StackedBar2D,$ 

STACK

ON GRAPH SET 
LOOKGRAPH STACK 
TYPE=REPORT,REPORT-VIEW=FUSIONCHART,CHART-TYPE=StackedBar3D,$ 
ON GRAPH SET 3D OFF 
TYPE=REPORT,REPORT-VIEW=FUSIONCHART,CHART-TYPE=StackedBar2D,$ 

HBRSTK1

ON GRAPH SET 
LOOKGRAPH HBRSTK1 
TYPE=REPORT,REPORT-VIEW=FUSIONCHART,CHART-TYPE=StackedBar3D,$ 
ON GRAPH SET 3D OFF 
TYPE=REPORT,REPORT-VIEW=FUSIONCHART,CHART-TYPE=StackedBar2D,$ 

3DSTACK

ON GRAPH SET 
LOOKGRAPH 3DSTACK 
TYPE=REPORT,REPORT-VIEW=FUSIONCHART,CHART-TYPE=StackedBar3D,$ 
ON GRAPH SET 3D OFF 
TYPE=REPORT,REPORT-VIEW=FUSIONCHART,CHART-TYPE=StackedBar2D,$ 

HBRSTKPC

ON GRAPH SET 
LOOKGRAPH HBRSTKPC 
TYPE=REPORT,REPORT-VIEW=FUSIONCHART,CHART-TYPE=StackedBar3D,$ 
ON GRAPH SET 3D OFF 
TYPE=REPORT,REPORT-VIEW=FUSIONCHART,CHART-TYPE=StackedBar2D,$ 

HBRSTK2

ON GRAPH SET 
LOOKGRAPH HBRSTK2 
TYPE=REPORT,REPORT-VIEW=FUSIONCHART,CHART-TYPE=StackedBar3D,$ 
ON GRAPH SET 3D OFF 
TYPE=REPORT,REPORT-VIEW=FUSIONCHART,CHART-TYPE=StackedBar2D,$ 

HBRSTK2S

ON GRAPH SET 
LOOKGRAPH HBRSTK2S 
TYPE=REPORT,REPORT-VIEW=FUSIONCHART,CHART-TYPE=StackedBar3D,$ 
ON GRAPH SET 3D OFF 
TYPE=REPORT,REPORT-VIEW=FUSIONCHART,CHART-TYPE=StackedBar2D,$ 

Column Chart Types

Type

LOOKGRAPH Syntax

CHART-TYPE Syntax

VBAR

ON GRAPH SET 
LOOKGRAPH VBAR 
TYPE=REPORT,REPORT-
VIEW=CHART,CHART-TYPE=BAR,$
ON GRAPH SET 3D OFF 
TYPE=REPORT,REPORT-VIEW=FUSIONCHART,CHART-TYPE=MSColumn2D,$

3D_BAR

ON GRAPH SET
LOOKGRAPH 3D_BAR 
TYPE=REPORT,REPORT-
VIEW=FUSIONCHART,CHART-TYPE=MSColumn3D,$ 

3DGROUP

ON GRAPH SET LOOKGRAPH 3DGROUP 
TYPE=REPORT,REPORT-VIEW=FUSIONCHART,CHART-TYPE=MSColumn3D,$ 

VBAR2AX

ON GRAPH SET
LOOKGRAPH VBAR2AX 
TYPE=REPORT,REPORT-
VIEW=CHART,CHART-TYPE=BAR,$ 

VBAR2AXS

ON GRAPH SET LOOKGRAPH VBAR2AXS 
TYPE=REPORT,REPORT-VIEW=CHART,CHART-TYPE=BAR,$ 

MULTI3Y

ON GRAPH SET LOOKGRAPH MULTI3Y 
TYPE=REPORT,REPORT-VIEW=CHART,CHART-TYPE=BAR,$ 

MULTI4Y

ON GRAPH SET LOOKGRAPH MULTI4Y
TYPE=REPORT,REPORT-VIEW=CHART,CHART-TYPE=BAR,$ 

MULTI5Y

ON GRAPH SET LOOKGRAPH MULTI5Y
TYPE=REPORT,REPORT-VIEW=CHART,CHART-TYPE=BAR,$

VBRSTK1

ON GRAPH SET LOOKGRAPH VBRSTK1 
TYPE=REPORT,REPORT-VIEW=FUSIONCHART,CHART-TYPE=StackedColumn3D,$ 
ON GRAPH SET 3D OFF 
TYPE=REPORT,REPORT-VIEW=FUSIONCHART,CHART-TYPE=StackedColumn2D,$ 

VBRSTKPC

ON GRAPH SET LOOKGRAPH VBRSTKPC 
TYPE=REPORT,REPORT-VIEW=FUSIONCHART,CHART-TYPE=StackedColumn3D,$ 
ON GRAPH SET 3D OFF 
TYPE=REPORT,REPORT-VIEW=FUSIONCHART,CHART-TYPE=StackedColumn2D,$ 

VBRSTK2

ON GRAPH SET LOOKGRAPH VBRSTK2 
TYPE=REPORT,REPORT-VIEW=FUSIONCHART,CHART-TYPE=StackedColumn3D,$ 
ON GRAPH SET 3D OFF 
TYPE=REPORT,REPORT-VIEW=FUSIONCHART,CHART-TYPE=StackedColumn2D,$ 

VBRSTK2S

ON GRAPH SET LOOKGRAPH VBRSTK2S 
TYPE=REPORT,REPORT-VIEW=FUSIONCHART,CHART-TYPE=StackedColumn3D,$ 
ON GRAPH SET 3D OFF 
TYPE=REPORT,REPORT-VIEW=FUSIONCHART,CHART-TYPE=StackedColumn2D,$ 

Pie Chart Types

Type

LOOKGRAPH Syntax

CHART-TYPE Syntax

PIE

ON GRAPH SET
LOOKGRAPH PIE 
TYPE=REPORT,REPORT-VIEW=CHART,CHART-TYPE=PIE,$ 

PIESINGL

ON GRAPH SET 
LOOKGRAPH PIESINGL 
TYPE=REPORT,REPORT-VIEW=CHART,CHART-TYPE=PIE,$ 

PIEMULTI

ON GRAPH SET 
LOOKGRAPH PIEMULTI 
TYPE=REPORT,REPORT-VIEW=FUSIONCHART,CHART-TYPE=Pie3D,$ 
ON GRAPH SET 3D OFF 
TYPE=REPORT,REPORT-VIEW=FUSIONCHART,CHART-TYPE=Pie2D,$ 

PIEMULTP

ON GRAPH SET 
LOOKGRAPH PIEMULTP 
TYPE=REPORT,REPORT-VIEW=FUSIONCHART,CHART-TYPE=Pie3D,$ 
ON GRAPH SET 3D OFF 
TYPE=REPORT,REPORT-VIEW=FUSIONCHART,CHART-TYPE=Pie2D,$ 

PIEBAR

ON GRAPH SET 
LOOKGRAPH PIEBAR 
TYPE=REPORT,REPORT-VIEW=CHART,CHART-TYPE=PIE,$ 

Doughnut Chart Types

Type

LOOKGRAPH Syntax

CHART-TYPE Syntax

PIERING

ON GRAPH SET 
LOOKGRAPH PIERING 
TYPE=REPORT,REPORT-VIEW=FUSIONCHART,CHART-TYPE=Doughnut3D,$ 
ON GRAPH SET 3D OFF 
TYPE=REPORT,REPORT-VIEW=FUSIONCHART,CHART-TYPE=Doughnut2D,$ 

PIEMULPR

ON GRAPH SET 
LOOKGRAPH PIEMULPR 
TYPE=REPORT,REPORT-VIEW=FUSIONCHART,CHART-TYPE=Doughnut3D,$ 
ON GRAPH SET 3D OFF 
TYPE=REPORT,REPORT-VIEW=FUSIONCHART,CHART-TYPE=Doughnut2D,$ 

PIEMULTR

ON GRAPH SET 
LOOKGRAPH PIEMULTR 
TYPE=REPORT,REPORT-VIEW=FUSIONCHART,CHART-TYPE=Doughnut3D,$ 
ON GRAPH SET 3D OFF 
TYPE=REPORT,REPORT-VIEW=FUSIONCHART,CHART-TYPE=Doughnut2D,$ 

PIERBAR

ON GRAPH SET 
LOOKGRAPH PIERBAR 
TYPE=REPORT,REPORT-VIEW=FUSIONCHART,CHART-TYPE=Doughnut3D,$ 
ON GRAPH SET 3D OFF 
TYPE=REPORT,REPORT-VIEW=FUSIONCHART,CHART-TYPE=Doughnut2D,$ 

Line Chart Types

Type

LOOKGRAPH Syntax

CHART-TYPE Syntax

LINE

ON GRAPH SET 
LOOKGRAPH LINE 
TYPE=REPORT,REPORT-VIEW=CHART,
CHART-TYPE=LINE,$ 

HLINE

ON GRAPH SET 
LOOKGRAPH HLINE 
TYPE=REPORT,REPORT-VIEW=CHART,
CHART-TYPE=LINE,$ 

HLINE2

ON GRAPH SET 
LOOKGRAPH HLINE2 
TYPE=REPORT,REPORT-VIEW=CHART,
CHART-TYPE=LINE,$ 

HLINE2S

ON GRAPH SET 
LOOKGRAPH HLINE2S 
TYPE=REPORT,REPORT-VIEW=CHART,
CHART-TYPE=LINE,$ 

HLINSTK

ON GRAPH SET 
LOOKGRAPH HLINSTK 
TYPE=REPORT,REPORT-VIEW=CHART,
CHART-TYPE=LINE,$ 

HLINSTK2

ON GRAPH SET 
LOOKGRAPH HLINSTK2 
TYPE=REPORT,REPORT-VIEW=CHART,
CHART-TYPE=LINE,$ 

HLNSTK2S

ON GRAPH SET 
LOOKGRAPH HLNSTK2S 
TYPE=REPORT,REPORT-VIEW=CHART,
CHART-TYPE=LINE,$ 

HLNSTKPC

ON GRAPH SET 
LOOKGRAPH HLNSTKPC 
TYPE=REPORT,REPORT-VIEW=CHART,
CHART-TYPE=LINE,$ 

VLINE

ON GRAPH SET 
LOOKGRAPH VLINE 
TYPE=REPORT,REPORT-VIEW=CHART,
CHART-TYPE=LINE,$ 
ON GRAPH SET 3D OFF 
TYPE=REPORT,REPORT-VIEW=FUSIONCHART,
CHART-TYPE=MSLine,$ 

VLINE2

ON GRAPH SET 
LOOKGRAPH VLINE2 
TYPE=REPORT,REPORT-VIEW=CHART,
CHART-TYPE=LINE,$ 
ON GRAPH SET 3D OFF 
TYPE=REPORT,REPORT-VIEW=FUSIONCHART,
CHART-TYPE=MSLine,$ 

VLINE2S

ON GRAPH SET 
LOOKGRAPH VLINE2S 
TYPE=REPORT,REPORT-VIEW=CHART,
CHART-TYPE=LINE,$ 

VLINSTK

ON GRAPH SET 
LOOKGRAPH VLINSTK 
TYPE=REPORT,REPORT-VIEW=CHART,
CHART-TYPE=LINE,$ 

VLINSTK2

ON GRAPH SET 
LOOKGRAPH VLINSTK2 
TYPE=REPORT,REPORT-VIEW=CHART,
CHART-TYPE=LINE,$ 

VLNSTK2S

ON GRAPH SET 
LOOKGRAPH VLNSTK2S 
TYPE=REPORT,REPORT-VIEW=CHART,
CHART-TYPE=LINE,$ 

VLNSTKPC

ON GRAPH SET 
LOOKGRAPH VLNSTKPC 
TYPE=REPORT,REPORT-VIEW=CHART,
CHART-TYPE=LINE,$ 

Area Chart Types

Type

LOOKGRAPH Syntax

CHART-TYPE Syntax

AREA

ON GRAPH SET 
LOOKGRAPH AREA 
TYPE=REPORT,REPORT-VIEW=FUSIONCHART,
CHART-TYPE=MSArea,$

HAREA

ON GRAPH SET 
LOOKGRAPH HAREA 
TYPE=REPORT,REPORT-VIEW=FUSIONCHART,
CHART-TYPE=MSArea,$ 

HAREAR2

ON GRAPH SET 
LOOKGRAPH HAREAR2 
TYPE=REPORT,REPORT-VIEW=FUSIONCHART,
CHART-TYPE=MSArea,$  

HAREASTK

ON GRAPH SET 
LOOKGRAPH HAREASTK 
TYPE=REPORT,REPORT-VIEW=FUSIONCHART,
CHART-TYPE=StackedArea2D,$ 

HARESTKP

ON GRAPH SET 
LOOKGRAPH HARESTKP 
TYPE=REPORT,REPORT-VIEW=FUSIONCHART,
CHART-TYPE=StackedArea2D,$ 

HARESTK2

ON GRAPH SET 
LOOKGRAPH HARESTK2 
TYPE=REPORT,REPORT-VIEW=FUSIONCHART,
CHART-TYPE=StackedArea2D,$ 

VAREA

ON GRAPH SET 
LOOKGRAPH VAREA 
TYPE=REPORT,REPORT-VIEW=FUSIONCHART,
CHART-TYPE=MSArea,$ 

3DAREAS

ON GRAPH SET 
LOOKGRAPH 3DAREAS 
TYPE=REPORT,REPORT-VIEW=FUSIONCHART,
CHART-TYPE=MSArea,$  

3DAREAG

ON GRAPH SET 
LOOKGRAPH 3DAREAG 
TYPE=REPORT,REPORT-VIEW=FUSIONCHART,
CHART-TYPE=MSArea,$ 

VAREAR2

ON GRAPH SET 
LOOKGRAPH VAREAR2 
TYPE=REPORT,REPORT-VIEW=FUSIONCHART,
CHART-TYPE=MSArea,$

VAREASTK

ON GRAPH SET 
LOOKGRAPH VAREASTK 
TYPE=REPORT,REPORT-VIEW=FUSIONCHART,
CHART-TYPE=StackedArea2D,$ 

VARESTKP

ON GRAPH SET 
LOOKGRAPH VARESTKP 
TYPE=REPORT,REPORT-VIEW=FUSIONCHART,
CHART-TYPE=StackedArea2D,$ 

VARESTK2

ON GRAPH SET 
LOOKGRAPH VARESTK2
TYPE=REPORT,REPORT-VIEW=FUSIONCHART,
CHART-TYPE=StackedArea2D,$

Scatter Chart Types

Type

LOOKGRAPH Syntax

CHART-TYPE Syntax

SCATTER

ON GRAPH SET 
LOOKGRAPH SCATTER 
TYPE=REPORT,REPORT-VIEW=CHART,
CHART-TYPE=SCATTER,$ 

SCATTERS

ON GRAPH SET 
LOOKGRAPH SCATTERS 
TYPE=REPORT,REPORT-VIEW=FUSIONCHART,
CHART-TYPE=Scatter,$ 

SCATTRLS

ON GRAPH SET 
LOOKGRAPH SCATTRLS 
TYPE=REPORT,REPORT-VIEW=CHART,
CHART-TYPE=SCATTER,$ 

SCATTRLD

ON GRAPH SET 
LOOKGRAPH SCATTRLD 
TYPE=REPORT,REPORT-VIEW=FUSIONCHART,
CHART-TYPE=Scatter,$ 

SCATTERD

ON GRAPH SET 
LOOKGRAPH SCATTERD 
TYPE=REPORT,REPORT-VIEW=FUSIONCHART,
CHART-TYPE=Scatter,$ 

SCATTERN

ON GRAPH SET 
LOOKGRAPH SCATTERN 
TYPE=REPORT,REPORT-VIEW=CHART,
CHART-TYPE=SCATTER,$ 

Bubble Chart Types

Type

LOOKGRAPH Syntax

CHART-TYPE Syntax

BUBBLE

ON GRAPH SET 
LOOKGRAPH BUBBLE 
TYPE=REPORT,REPORT-VIEW=FUSIONCHART,
CHART-TYPE=Bubble,$ 

BUBBLED

ON GRAPH SET 
LOOKGRAPH BUBBLED 
TYPE=REPORT,REPORT-VIEW=FUSIONCHART,
CHART-TYPE=Bubble,$ 

BUBBLEDL

ON GRAPH SET 
LOOKGRAPH BUBBLEDL 
TYPE=REPORT,REPORT-VIEW=FUSIONCHART,
CHART-TYPE=Bubble,$ 

BUBBLEL

ON GRAPH SET 
LOOKGRAPH BUBBLEL 
TYPE=REPORT,REPORT-VIEW=FUSIONCHART,
CHART-TYPE=Bubble,$ 

Radar Chart Types

Type

LOOKGRAPH Syntax

CHART-TYPE Syntax

RADARA

ON GRAPH SET 
LOOKGRAPH RADARA 
TYPE=REPORT,REPORT-VIEW=FUSIONCHART,
CHART-TYPE=Radar,$ 

RADARL

ON GRAPH SET 
LOOKGRAPH RADARL 
TYPE=REPORT,REPORT-VIEW=FUSIONCHART,
CHART-TYPE=Radar,$ 

RADARL2

ON GRAPH SET 
LOOKGRAPH RADARL2 
TYPE=REPORT,REPORT-VIEW=FUSIONCHART,
CHART-TYPE=Radar,$ 

RADARAG

ON GRAPH SET 
LOOKGRAPH RADARAG 
TYPE=REPORT,REPORT-VIEW=FUSIONCHART,
CHART-TYPE=Radar,$ 

RADARL2G

ON GRAPH SET 
LOOKGRAPH RADARL2G 
TYPE=REPORT,REPORT-VIEW=FUSIONCHART,
CHART-TYPE=Radar,$ 

RADARLG

ON GRAPH SET 
LOOKGRAPH RADARLG 
TYPE=REPORT,REPORT-VIEW=FUSIONCHART,
CHART-TYPE=Radar,$ 

Funnel Chart Types

Type

LOOKGRAPH Syntax

CHART-TYPE Syntax

FUNNEL

ON GRAPH SET 
LOOKGRAPH FUNNEL
TYPE=REPORT,REPORT-VIEW=FUSIONCHART,
CHART-TYPE=Funnel,$ 

Pyramid Chart Types

Type

LOOKGRAPH Syntax

CHART-TYPE Syntax

PYRAMID

ON GRAPH SET 
LOOKGRAPH PYRAMID 
TYPE=REPORT,REPORT-VIEW=FUSIONCHART,
CHART-TYPE=Pyramid,$ 

Additional Active Technologies Chart Types Available With CHART-TYPE Syntax

The following table lists additional active chart types that you can generate when running a TABLE FILE procedure, using CHART-TYPE syntax.

Chart Name

CHART-TYPE Syntax

Column 3D

TYPE=REPORT,REPORT-VIEW=FUSIONCHART,
CHART-TYPE=Column3D,$

Scroll Multi-Series Column 2D

TYPE=REPORT,REPORT-VIEW=FUSIONCHART,
CHART-TYPE=ScrollColumn2D,$ 

Scroll Stacked Column 2D

TYPE=REPORT,REPORT-VIEW=FUSIONCHART,
CHART-TYPE=ScrollStackedColumn2D,$ 

Logarithmic Multi-Series Column 2D

TYPE=REPORT,REPORT-VIEW=FUSIONCHART,
CHART-TYPE=LogMSColumn2D,$ 

Inverse Y-Axis Multi-Series Column 2D

TYPE=REPORT,REPORT-VIEW=FUSIONCHART,
CHART-TYPE=InverseMSColumn2D,$ 

Bar 2D

TYPE=REPORT,REPORT-VIEW=FUSIONCHART,
CHART-TYPE=Bar2D,$

Line 2D

TYPE=REPORT,REPORT-VIEW=FUSIONCHART,
CHART-TYPE=Line,$

Scroll Multi-Series Line 2D

TYPE=REPORT,REPORT-VIEW=FUSIONCHART,
CHART-TYPE=ScrollLine2D,$ 

Logarithmic Multi-Series Line

TYPE=REPORT,REPORT-VIEW=FUSIONCHART,
CHART-TYPE=LogMSLine,$ 

Inverse Y-Axis Multi-Series Line 2D

TYPE=REPORT,REPORT-VIEW=FUSIONCHART,
CHART-TYPE=InverseMSLine,$ 

Spline

TYPE=REPORT,REPORT-VIEW=FUSIONCHART,
CHART-TYPE=Spline,$

Multi-Series Spline

TYPE=REPORT,REPORT-VIEW=FUSIONCHART,
CHART-TYPE=MSSpline,$ 

Area 2D

TYPE=REPORT,REPORT-VIEW=FUSIONCHART,
CHART-TYPE=Area2D,$ 

Scroll Multi-Series Area 2D

TYPE=REPORT,REPORT-VIEW=FUSIONCHART,
CHART-TYPE=ScrollArea2D,$ 

Inverse Y-Axis Multi-Series Area

TYPE=REPORT,REPORT-VIEW=FUSIONCHART,
CHART-TYPE=InverseMSArea,$ 

Spline Area

TYPE=REPORT,REPORT-VIEW=FUSIONCHART,
CHART-TYPE=SplineArea,$

Multi-Series Spline Area

TYPE=REPORT,REPORT-VIEW=FUSIONCHART,
CHART-TYPE=MSSplineArea,$ 

Chart Types Mapped to Default Chart Types

The following table lists the chart types that are mapped to the default bar type or to another type when there is no corresponding chart type available in Active Technologies. LOOKGRAPH syntax is used.

Type

LOOKGRAPH Syntax

Mapped To

3DCONE

ON GRAPH SET LOOKGRAPH 3DCONE 

BAR

3DCUBE

ON GRAPH SET LOOKGRAPH 3DCUBE 

BAR

3DCYLDER

ON GRAPH SET LOOKGRAPH 3DCYLDER 

BAR

3DGLOBE

ON GRAPH SET LOOKGRAPH 3DGLOBE 

BAR

3DOCTAGN

ON GRAPH SET LOOKGRAPH 3DOCTAGN 

BAR

3DPYRAMD

ON GRAPH SET LOOKGRAPH 3DPYRAMD 

BAR

3DRIBBNG

ON GRAPH SET LOOKGRAPH 3DRIBBNG 

LINE

3DRIBBNS

ON GRAPH SET LOOKGRAPH 3DRIBBNS 

LINE

3DSMOOTH

ON GRAPH SET LOOKGRAPH 3DSMOOTH 

MSArea

3DSPHERE

ON GRAPH SET LOOKGRAPH 3DSPHERE 

BAR

3DSURFCE

ON GRAPH SET LOOKGRAPH 3DSURFCE 

LINE

3DSURFHC

ON GRAPH SET LOOKGRAPH 3DSURFHC 

MSArea

3DSURFSD

ON GRAPH SET LOOKGRAPH 3DSURFSD 

MSArea

BOXPLOT

ON GRAPH SET LOOKGRAPH BOXPLOT 

BAR

ERRORBAR

ON GRAPH SET LOOKGRAPH ERRORBAR 

BAR

HHISTOGR

ON GRAPH SET LOOKGRAPH HHISTOGR 

BAR

HWATERFL

ON GRAPH SET LOOKGRAPH HWATERFL 

BAR

PARETO

ON GRAPH SET LOOKGRAPH PARETO 

BAR

POLAR

ON GRAPH SET LOOKGRAPH POLAR 

Radar

POLAR2

ON GRAPH SET LOOKGRAPH POLAR2 

Radar

POSITION

ON GRAPH SET LOOKGRAPH POSITION 

SCATTER

RESOURCE

ON GRAPH SET LOOKGRAPH RESOURCE 

BAR

SPECTRAL

ON GRAPH SET LOOKGRAPH SPECTRAL 

BAR

STOCK

ON GRAPH SET LOOKGRAPH STOCK 

BAR

STOCKC

ON GRAPH SET LOOKGRAPH STOCKC 

BAR

STOCKCV

ON GRAPH SET LOOKGRAPH STOCKCV 

BAR

STOCKH

ON GRAPH SET LOOKGRAPH STOCKH 

BAR

STOCKHB

ON GRAPH SET LOOKGRAPH STOCKHB 

BAR

STOCKHC

ON GRAPH SET LOOKGRAPH STOCKHC 

BAR

STOCKHCB

ON GRAPH SET LOOKGRAPH STOCKHCB 

BAR

STOCKHCD

ON GRAPH SET LOOKGRAPH STOCKHCD 

BAR

STOCKHCL

ON GRAPH SET LOOKGRAPH STOCKHCL 

BAR

STOCKHCV

ON GRAPH SET LOOKGRAPH STOCKHCV 

BAR

STOCKHD

ON GRAPH SET LOOKGRAPH STOCKHD 

BAR

STOCKHOB

ON GRAPH SET LOOKGRAPH STOCKHOB 

BAR

STOCKHOC

ON GRAPH SET LOOKGRAPH STOCKHOC 

BAR

STOCKHOD

ON GRAPH SET LOOKGRAPH STOCKHOD 

BAR

STOCKHOV

ON GRAPH SET LOOKGRAPH STOCKHOV 

BAR

STOCKHV

ON GRAPH SET LOOKGRAPH STOCKHV 

BAR

STOCKLCV

ON GRAPH SET LOOKGRAPH STOCKLCV 

BAR

VHISTOGR

ON GRAPH SET LOOKGRAPH VHISTOGR 

BAR

VWATERFL

ON GRAPH SET LOOKGRAPH VWATERFL 

BAR


WebFOCUS