How to:
Reference: |
Available Languages: reporting
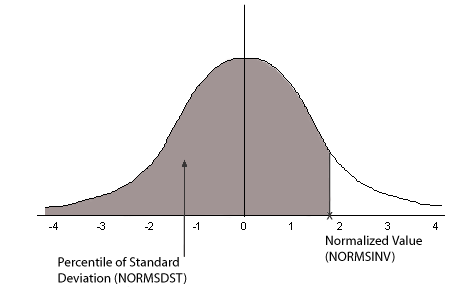
The NORMSDST and NORMSINV functions perform calculations on a standard normal distribution curve:
The results of NORMSDST and NORMSINV are returned as double-precision and are accurate to 6 significant digits.
A standard normal distribution curve is a normal distribution that has a mean of 0 and a standard deviation of 1. The total area under this curve is 1. A point on the X-axis of the standard normal distribution is called a normalized value. Assuming that your data is normally distributed, you can convert a data point to a normalized value to find the percentage of scores that are less than or equal to the raw score.
You can convert a value (raw score) from your normally distributed data to the equivalent normalized value (z-score) as follows:
z = (raw_score - mean)/standard_deviation
To convert from a z-score back to a raw score, use the following formula:
raw_score = z * standard_deviation + mean
The mean of data points xi, where i is from 1 to n is:

The standard deviation of data points xi, where i is from 1 to n is:

The following diagram illustrates the results of the NORMSDST and NORMSINV functions:

Many common measurements are normally distributed. A plot of normally distributed data values approximates a bell-shaped curve. The two measures required to describe any normal distribution are the mean and the standard deviation:
NORMSDST(value, 'D8');where:
Is a normalized value.
Is the required format for the result. The value returned by the function is double-precision. You can assign it to a field with any valid numeric format.
NORMSINV(value, 'D8');where:
Is a number between 0 and 1 which represents the a percentile in a standard normal distribution.
Is the required format for the result. The value returned by the function is double-precision. You can assign it to a field with any valid numeric format.
NORMSDST finds the percentile for the Z field. NORMSINV then returns this percentile to a normalized value.
DEFINE FILE GGPRODS
-* CONVERT SIZE FIELD TO DOUBLE PRECISION
X/D12.5 = SIZE;
END
TABLE FILE GGPRODS
SUM X NOPRINT CNT.X NOPRINT
-* CALCULATE MEAN AND STANDARD DEVIATION
COMPUTE NUM/D12.5 = CNT.X; NOPRINT
COMPUTE MEAN/D12.5 = AVE.X; NOPRINT
COMPUTE VARIANCE/D12.5 = ((NUM*ASQ.X) - (X*X/NUM))/(NUM-1); NOPRINT
COMPUTE STDEV/D12.5 = SQRT(VARIANCE); NOPRINT
PRINT SIZE X NOPRINT
-* COMPUTE NORMALIZED VALUES AND USE AS INPUT TO NORMSDST FUNCTION
-* THEN USE RETURNED VALUES AS INPUT TO NORMSINV FUNCTION
-* AND CONVERT BACK TO DATA VALUES
COMPUTE Z/D12.5 = (X - MEAN)/STDEV;
COMPUTE NORMSD/D12.5 = NORMSDST(Z, 'D8');
COMPUTE NORMSI/D12.5 = NORMSINV(NORMSD, 'D8');
COMPUTE DSIZE/D12 = NORMSI * STDEV + MEAN;
BY PRODUCT_ID NOPRINT
END
The output is:
Size | Z | NORMSD | NORMSI | DSIZE |
16 12 12 20 24 20 24 16 12 8 | -.07298 -.80273 -.80273 .65678 1.38654 .65678 1.38654 -.07298 -.80273 -1.53249 | .47091 .21106 .21106 .74434 .91721 .74434 .91721 .47091 .21106 .06270 | -.07298 -.80273 -.80273 .65678 1.38654 .65678 1.38654 -.07298 -.80273 1.53249 | 16
12
12
20
24
20
24
16
12
8 |
| WebFOCUS |