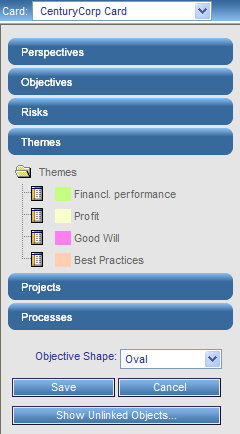
- On the Author tab, click Scorecards to expand the CenturyCorp Card folder until you see Themes.
- Click the Themes folder to expand it.
-
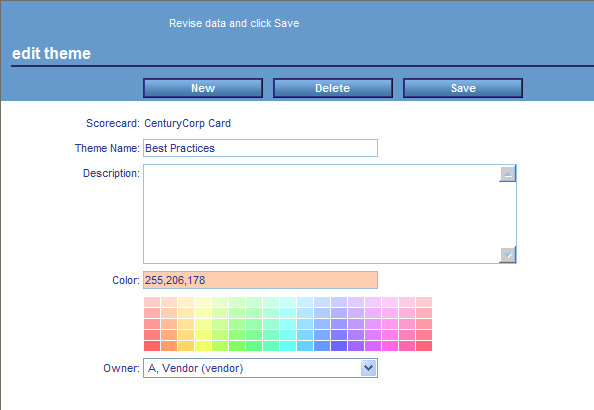
Click
a theme, for example, Best Practices, to see
the Edit Theme form.
You can also right-click a theme and select New to create a new theme.
If you are creating a new theme, select the desired scorecard from the Scorecard drop-down list. For existing themes, the Scorecard name cannot be edited.
- In the Name field, type a name for the theme.
- In the Description field, type a description.
- Under the Color field, select a color. The Color field displays the numbers representing the RGB (red, green, and blue) for the color you choose.
- In the Owner field, select an owner from the drop-down list.
- Click the Save button near the top of the Edit Theme form.
- Click the Strategy tab to go to the Strategy Map.
-
Click
the Refresh Contents
 icon
at the top right corner of the Strategy Map.
icon
at the top right corner of the Strategy Map.
The Strategy Map refreshes updating colors, trends, and active status indicators. You may notice some or all of the following:
- The background color for an objective is the same as the indicator color for that objective.
- Up and down arrows represent the trends.
- A Project
 icon
indicates that projects are aligned with the objective below it.
If you click the indicator, you can drill down to more project data
including schedule and budget status, project impact data, and project-related
reports.
icon
indicates that projects are aligned with the objective below it.
If you click the indicator, you can drill down to more project data
including schedule and budget status, project impact data, and project-related
reports. - A red metric
 icon
indicates that a measure below the objective is lower than the desired
threshold, which is a sign of poor performance. If you click the
icon, you can quickly drill to a view of the underachieving measure.
icon
indicates that a measure below the objective is lower than the desired
threshold, which is a sign of poor performance. If you click the
icon, you can quickly drill to a view of the underachieving measure. - A feedback
 icon
indicates that feedback has been recorded for an objective or measure
below it. If you hover the mouse over the icon, the most recent feedback
is displayed. If you click the icon, you can drill down to a view
where you can read and edit the feedback.
icon
indicates that feedback has been recorded for an objective or measure
below it. If you hover the mouse over the icon, the most recent feedback
is displayed. If you click the icon, you can drill down to a view
where you can read and edit the feedback.
-
To see
the themes and colors you selected, expand the Themes tree
in the Strategy Map, which is shown in the following image. A new
theme, Consistently high market share, was created for the purpose
of this example.
-
Click
the new theme, Consistently high market share.
It appears in the upper left corner of the Strategy Map.
Click an objective representative of the theme, such as High customer renewal rate. A halo of the applicable color appears around the objective.

- Click Save to save the Strategy Map.
You can go back into the Strategy Map at any time and change the strategy. When you change your Strategy Map, the views change to reflect your changes. Your Strategy Map controls how everything in PMF is linked together.