Using the Analysis Designer
The Analysis Designer option in the Analytics tab enables
you to specify parameter options and run a view based on those options.
The available parameter options are grouped into three sections:
Filters, Content, and Output.
In the Filters section of the Analysis Designer, you can filter
the view by selecting any combination of specific values including
time, product, scorecard, objective, perspective, theme, metrics,
location, organization, and measure. If you want to select multiple measures,
click the browse (...) button to the right of the Measure drop-down
list and the Multi-Measure Selector dialog box opens.
Note that you can now force the report to always use the selected
scorecard by selecting the check box next to Scorecard in the Analysis
Designer. Leaving it unselected allows an end user to pass the scorecard
they wish to view at run time.
In the Content section of the Analysis Designer, you can select
a report template, sort criteria, and the type of data you want
to show. There are nine different report templates that you can
select: Metrics Vertical Sort, Metrics Across Dimension, Metrics
Crosstab, Objectives Vertical Sort, Objectives Across Dimension,
Objectives Crosstab, Themes Vertical Sort, Themes Across Dimension,
and Themes Crosstab. You can select from primary and secondary vertical
sort fields, and a horizontal sort field when you select the Metrics
Across Dimension or Objectives Across Dimension report templates. Views can be sorted by perspective,
objective, year, quarter, month, location, product, organization,
supplier, or theme. You can control the output by selecting to show
actual output data, multiple alternate targets plus indicators,
or the percentage of goals achieved plus indicator information.
For an example of displaying multiple alternate targets in a view, see Running the Metrics Vertical Sort View. Additionally, the Analysis Designer enables
you to show any combination of value, percent reached, and indicator
to compare up to four columns of data. This gives you the ability
to create thousands of different views.
In the Output section of the Analysis Designer, you determine
the output format by selecting to display the view in a browser,
a PDF file, an Excel spreadsheet, or a WebFOCUS HTML active report
which can be e-mailed to end users for offline analysis. Use the
Report Title field to type an appropriate name for the view so it
can be saved for future use.
xRunning the Metrics Across Dimension View
PMF provides the Metrics Across Dimension template,
which you can use to create a view that displays metrics horizontally
across your organization using the selected parameters. This view
requires you to select an Across sort field.
To run the Metrics Across Dimension view, select Analysis in the
Type drop-down list of the Analytics tab, then select Analysis Designer from
the View drop-down list and click Run. The
Analysis Designer opens where you select the desired report template
and specify your parameter options, as shown in the following image.
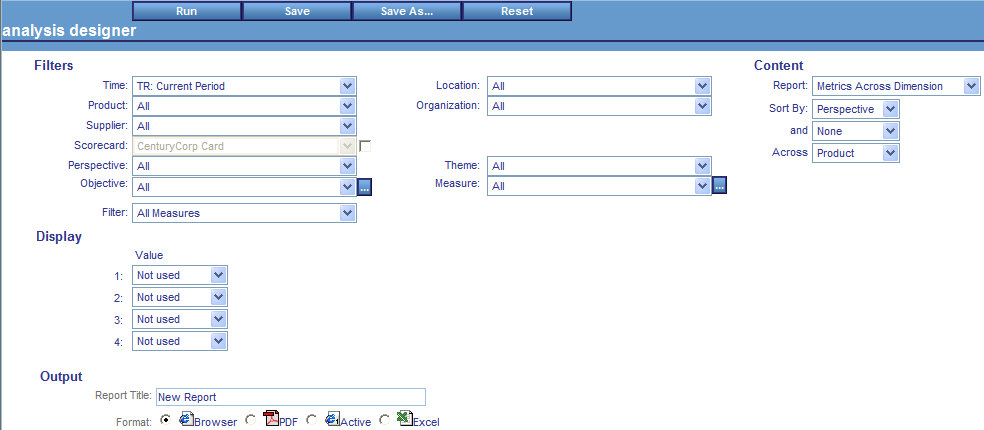
From the Report drop-down list, select Metrics Across Dimension,
select the desired parameters in the Filters and Content sections, type
a name in the Report Title field of the Output section (for example,
Product Analysis By Quarter), then click Run to
execute and open the grid in a new window.
The following image shows the Metrics Across Dimension view for
the selected parameter values.

The Options button at the top-left of the view enables you to
Print the view, Output (export) to an Excel file, Output to a PDF,
or Schedule the run time and distribution of the view using the
Report Wizard. You can also display alternate target data in the
view by selecting Show Benchmark, Show Forecast, or Show Stretch
Target.
xRunning the Metrics Vertical Sort View
PMF provides the Metrics Vertical Sort template, which
you can use to create a view that displays metrics vertically using
the selected parameters and vertical sort field.
To run the Metrics Analysis, first select Analysis from
the Type drop-down list of the Analytics tab, then select Analysis
Designer from the View drop-down list and click Run.
The Analysis Designer opens where you select the desired report
template and specify your parameter options.
From the Report drop-down list, select Metrics Vertical
Sort, and select the desired parameters in the Filters
and Content sections. In the Display section, in line 1, select Actual for
Value, Indicator for Type, and Forecast for
Target. In line 2, select Actual for Value, Indicator for
Type, and Benchmark for Target. In line 3,
select Actual for Value, Indicator
+ Value + Pct Reached for Type, and Target for
Target. The following image shows the Analysis Designer with all
selected values for this view.

Type a name in the Report Title field of the Output section (for
example, Product Analysis By Month) and click Run to
execute and open this view in a new window. The following image
show the Metrics Vertical Sort view for the selected parameter values.

The Options button at the top-left of the view enables you to
Print the view, Output (export) to an Excel file, Output to a PDF,
or Schedule the run time and distribution of the view using the
Report Wizard. You can also display alternate target data in the
view by selecting Show Benchmark, Show Forecast, or Show Stretch
Target.
xRunning the Metrics Crosstab View
PMF provides the Metrics Crosstab template, which you
can use to create a view that displays metrics horizontally using
the selected parameters. This view enables you to see dimensional
breakouts across many measures. When you run the Metrics Crosstab
report, you can visually analyze your measures on a point-to-point
basis across the selected sorting levels.
To run the Metrics Analysis, first select Analysis from
the Type drop-down list of the Analytics tab, then select Analysis
Designer from the View drop-down list and click Run.
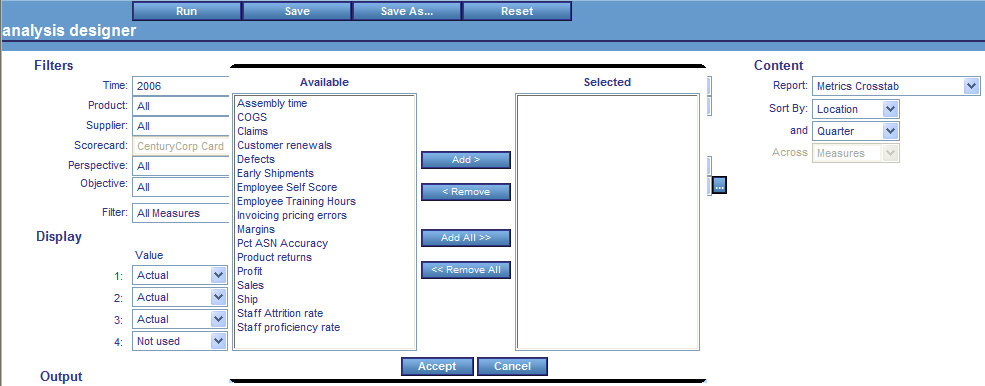
The Analysis Designer opens where you select the desired report
template and specify your parameter options. If you click the browse
(...) button to the right of the Measure drop-down list, you can
select multiple measures to personalize the columns you want displayed
in the output.
The following image shows the multi-select pop-up dialog box
over the Analysis Designer.
From the Report drop-down list, select Metrics Crosstab,
select the desired parameters, type a name in the Report Title field,
then click Run to execute and open this view
in a new window. The following image shows an example of the Metrics
Crosstab view.

xCreating Active Technologies Reports
You can use the Analysis Designer to create HTML active
reports, which enables you to design personalized PMF output that
can be e-mailed to end users along with embedded data and built-in
browser-neutral analysis tools. To request your content to be delivered
as an active report, select the Active option
in the Format area of the Analysis Designer and click Run.
Note: The use of WebFOCUS HTML active reports requires
a specific software license from Information Builders.
x
To better facilitate generating performance trend views
with the Analysis Designer, standard trending dates are available
at the top of the Time dimension drop-down list in the Filters section
of the Analysis Designer. You can quickly create a trend view that looks
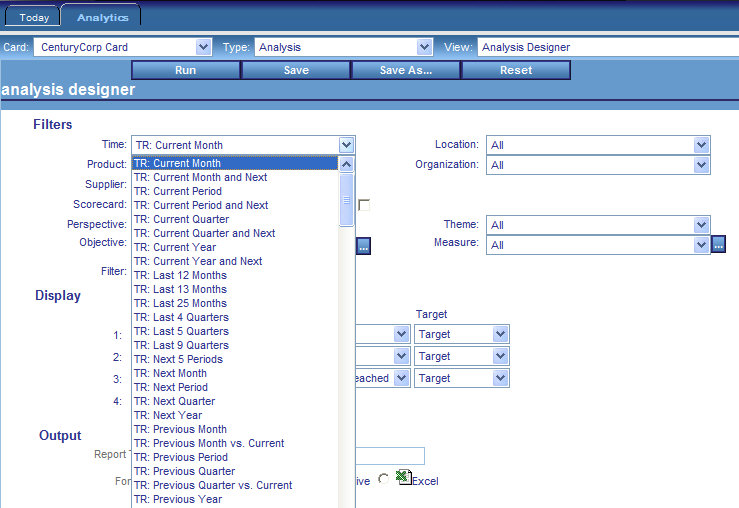
back from the current period to the start of the trend period selected.
For CenturyCorp Card, the default options available for the trend
periods include TR: Last 13 Months, TR: Last 25 Months, TR: Last
5 Quarters, and so on, as shown in the following image. The Current
Period is the default Time selection. You can jump to the predefined
trends by pressing the T key while the drop-down list is open.
If you create personalized trend periods using the Time Ranges
capability of the Manage tab, those values will be available in
the Filters section of the Analysis Designer. For more information,
see Manage Tab - Time Ranges.
xH-M-L Raw Counts and Percents of Total
You can use the Analysis Designer to report both the total Hi-Mid-Low
(H-M-L or red/yellow/green) counts for a metric range, as well as
the Hi-Mid-Low Percent of Total, which shows the share of each indicator
of the total count of metric values in that metric range.
These options can be found in the Display Fields drop-down menu
of the Analysis Designer, as shown in the following image.
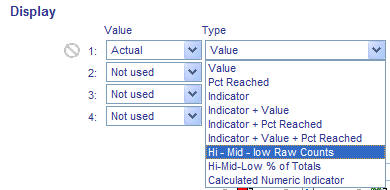
The display options are:
-
H-M-L Raw Counts. Displays
a count of High, Mid, and Low (Green, Yellow, and Red) values. This
is the count of rows for that metric and Dimensional intersection
that are each High, Mid and Low (Green, Yellow, and Red).
-
H-M-L % of Totals. Displays
the share of total High, Mid, and Low (Green, Yellow, and Red) values.
This is the percent share of total rows that are each Greens (Highs),
and Yellows (Mid), and Reds (Low).
xRanking Metrics and Objectives
Metrics and objectives for views and in gadgets can be displayed
based on the ranking of their performance or value. The available
options are Rank Ascending or Rank
Descending. The default sorting setting is alphabetic.
To set up Ranking, first select Analysis from
the Type drop-down list of the Analytics tab, then select Analysis
Designer from the View drop-down list and click Run.
The Analysis Designer opens where you select the desired report
template and specify your parameter options. If you click to the
left of the data field of the Value that you want to rank, a ranking
button appears, as shown in the following image.

If you click to the left of another field and the previous field
has been ranked, it will transfer to the newly selected field.
Note: Only Vertical Sort styles of the Measure, Objective,
and Theme templates can support ranking.
PMF ranking sorts the report information by the value or the
percent reached. For example, if you chose a value for actual or
target, PMF will rank based on the value of the field for the indicators.
If you choose a percent reached field, or a combo indicator, PMF
will rank based on the percent reached for the indicators.
If you choose a sort value from the Sorting options, PMF will
display the rank within the outermost sort type indicated. For example,
if sorting by one or more Dimensions, PMF will perform the rank
within the innermost dimension. If sorting by Perspective, PMF will
rank the items within each perspective. The only exception to this
is when sorting on the Time Dimension.
x
After you run a view, you can save its parameters and
run the view again later. To save a view created in the Analysis
Designer, type a name in the Report Title field in the Output section
and click Save.
x
To run a saved view, select Saved Reports in
the Type drop-down list of the Analytics tab, select the name of
the saved view from the View drop-down list, then click Run.
The following image shows the drop-down lists used to retrieve a
saved view.

x
You can change the parameters of any saved view. To
edit a saved view, select Saved Reports in
the Type drop-down list of the Analytics tab, select the desired
saved view from the View drop-down list, then click Edit.
The Report Options form opens where you can change your parameter
options. After you are done making changes, run the view to test
the results of your changes. If you are satisfied with the results,
click Save.