Essbase Reporting With WebFOCUS

In this section:


Top of page

x
Overview of Essbase Reporting Concepts

In a multi-dimensional data source (cube), dimensions are categories of data, such as Region or Time, that you use to analyze and compare business performance. Dimensions consist of data elements that are called members. For example, a Region dimension could have members England and France.

Dimension members are usually organized into hierarchies. Hierarchies can be viewed as tree-like graphs where members are the nodes.

For example, the Region dimension may have the element World at its top level (the root node). The World element may have children nodes (members) representing continents. Continents, in turn, can have children nodes that represent countries, and countries can have children nodes representing states or cities. Nodes with no children are called leaf nodes.

Measures are numeric values, such as Sales Volume or Net Income, that are used to quantify how your business is performing.

A multi-dimensional cube consists of data derived from facts, which are records about individual business transactions. For example, an individual fact record reflects a sales transaction of a certain number of items of a certain product at a certain price, which occurred in a certain store at a certain moment of time. The cube contains summarized fact values for all combinations of measures and members of different dimensions.

For example, the following combination (tuple) contains the total volume of sales of pumps in all stores in England in 2005:

{Sales Volume, Pumps, England, 2005}

The point in the cube that contains this summarized value is called a cell. A cell is addressed by a combination of members of different dimensions and a measure. In this example Sales Volume is a measure and Pumps, England, and 2005 are members of the Product, Region, and Time dimensions respectively.

Individual fact records are usually tied to the leaf nodes of each hierarchy in the cube. The fact values get included in cells addressed by these leaf nodes and added to all cells addressed by all combinations of ascendants of these leaf nodes along each hierarchy of the cube.

The operation used to summarize facts for some measures can be a simple sum or a more complex aggregation function such as an average.

In Essbase, it is assumed that a value exists for each combination of hierarchy values contained in the cube. Measures are not represented separately until the metadata is created. At that time you have the choice of simply creating a "cell" value tied to the existing combinations or exposing one or two of the dimensions as the measures.

Some combinations of hierarchy nodes may not have any fact records tied to them. The cells addressed by these combinations are empty cells.

As illustrated in the previous example, a tuple is a combination of members from different dimensions of a cube. The previous tuple contains members from all dimensions and, therefore, addresses a single cell. If a tuple contains only members from some dimensions, it addresses not just one cell but a whole slice of cells in the cube. For example, the following tuple does not include either Region or Time dimension members:

{Sales Volume, Pumps}

It addresses as many cells in the cube as there are members of the Region dimension times the number of members of the Time dimension.

The number of cells in the cube addressed by a single dimension member is a product of cardinalities of all other dimensions.

When all cells addressed by a member are empty, the member is called an empty member. When all cells addressed by a tuple are empty, the tuple is called an empty tuple.

By default, empty cells appear on report output. You can issue the following command if you want to eliminate them on the report output:

ENGINE ESSBASE SET SUPMISSING ON

Cubes can also include two types of attributes, which are parameters used in data selection. Attributes cannot be displayed or used for sorting; they can only be used in selection criteria.

When the adapter accesses a multi-dimensional cube, it uses two types of metadata elements about dimensions:

Using the hierarchy fields, the adapter can recreate the hierarchy and locate portions of the hierarchy needed to satisfy a request.


Top of page

x
Understanding Columnar and Hierarchical Reporting

Reference:

Two types of hierarchy are represented in a synonym: level and parent/child.

A synonym describes a level hierarchy by using a separate field for each level. To report on a level hierarchy, you use columnar reporting in which you specify the field name for each level you want to display.

A synonym describes a parent/child hierarchy using a set of fields that define the hierarchical structure and the relationships between the hierarchy members. The adapter has special hierarchical reporting syntax for reporting on parent/child hierarchies.

Hierarchical reporting enables you to sort and select members of parent/child hierarchies without knowing specific generation numbers. A hierarchical reporting request goes through several phases before output is displayed.

Hierarchical Sorting and Member Selection

The first phase selects hierarchy members to display. The hierarchical reporting phrase BY or ON HIERARCHY automatically sorts and formats a hierarchy with appropriate indentations that show the parent/child relationships. If you do not want to see the entire hierarchy, you can use the WHEN phrase to select hierarchy members for display. The expression in this WHEN phrase must reference only hierarchy fields, not dimension properties or measures.

Measures and dimension properties are linked to the leaf nodes of the dimension and, therefore, cannot be used in selecting hierarchy levels for display.

Screening Dimension Data

Once hierarchy members are selected, you can screen the retrieved dimension data by applying WHERE tests to the selected members.

WHERE criteria are applied to the leaf nodes and are processed after the phase of the request that selects hierarchy members. Therefore, dimension properties can be used in WHERE tests.

These tests can also reference hierarchy fields. However, since the selection criteria are always applied to the values at the leaf nodes, they cannot select data based on values that occur at higher levels. For example, in a dimension with Continents, Countries, and Cities, your request will not display any rows if you use WHERE to select at the Country level, but it may if you use it to select at the City level.

WHERE tests can also reference measures if the ENGINE ESSBASE RESTRICTSUM OFF command is in effect.

Screening Based on Aggregated Values

Measures, being summarized values, can be referenced in WHERE TOTAL tests and COMPUTE commands because those commands are processed after the hierarchy selection and aggregation phases of the request. When screening with WHERE TOTAL, the aggregation phase of the report processing is over, so totals on the report are not recalculated to account for the data that is screened out, the rows are just removed. In addition, if you use the RESTRICTSUM OFF setting, you can apply DEFINEs and WHERE tests to measures.


x
Reference: Prerequisites for Hierarchical Reporting

Hierarchical reporting uses special metadata attributes and reporting syntax. You must:

For more information on creating synonyms, see Creating Synonyms. For more information on hierarchical reporting, see Hierarchical Reporting.


Top of page

x
Representing Hierarchies in a Synonym

Dimensions are organized into sets of hierarchies. For example, in a Time dimension, years, quarters, and months can form a hierarchical or parent/child relationship. This means that the measures for each month are aggregated into values for quarters, and the quarters are aggregated into values for years. Each point in the hierarchy is called a node. Nodes at the bottom of the hierarchy (with no children) are called leaf nodes.

In a synonym, hierarchies can be described in one of two ways:

Dimension properties apply to all hierarchies in the dimension and are listed in the synonym following all of the hierarchies.


Example: Dimension Declaration

Each dimension begins with a dimension record that defines the dimension and its hierarchies. The dimension itself is generation zero.

Dimension:

DIMENSION=Products, CAPTION='Products', $


Example: Describing a Level Hierarchy

Each generation of the hierarchy is assigned a field name consisting of the hierarchy name (for example, Manufacturing) with the generation number appended (unless you changed the generation names in the Essbase Client application). Each field declaration also specifies the field name of its parent with the WITHIN attribute. The value stored in this field is the member caption (title).

If a new generation appears in the data, the synonym must be recreated to define this new generation.

The following field describes generation three. Its parent is generation 2:

 FIELDNAME=WAREHOUSE, ALIAS=Warehouse, USAGE=A11, ACTUAL=A11,
      WITHIN=PLANT,
      PROPERTY=UID,  $


Example: Describing a Parent/Child Hierarchy

Several fields are used to define a parent/child hierarchy. Each has a PROPERTY attribute that describes which hierarchy property it represents. The hierarchy field names are formed by appending a suffix to the hierarchy name.

For example, the caption of a hierarchy named Manufacturing2 is stored in a field whose name is MANUFACTURING_CAPTION and whose property attribute is PROPERTY=CAPTION.

The following table describes the hierarchy fields:

Description of Data

PROPERTY=

Field Suffix

Member's Unique ID (unique within the cube)

UID

_MEMBER

Member's Level Number

LEVEL_NUMBER

(Currently not used)

Member's Parent

PARENT_OF

_PARENT

Member's Caption (title on reports)

CAPTION

_CAPTION

Parent's Caption

CAP_PARENT

_PARENTCAP

The following declaration for the Manufacturing2 hierarchy describes the field that contains a member's unique ID (PROPERTY=UID):

 FIELDNAME=MANUFACTURING_MEMBER, ALIAS=Manufacturing, USAGE=A13,
      ACTUAL=A13,
      WITHIN='*Manufacturing2',
      PROPERTY=UID,  $

The following declaration for the Products2 hierarchy defines the field that contains a member's title (PROPERTY=CAPTION):

 FIELDNAME=MANUFACTURING_CAPTION, USAGE=A17, ACTUAL=A17,
      REFERENCE=MANUFACTURING_MEMBER, PROPERTY=CAPTION,  $


Example: Dimension Properties

Following all of a dimension's hierarchies, the dimension properties (called attributes) are described. Each of these has PROPERTY=UDA (User Defined Attribute) in the synonym.

For example the following field represents a member's warehouse management property:

 FIELDNAME=WHSE_MANAGEMENT, ALIAS='Whse Management', USAGE=A15,
    ACTUAL=A15,
    REFERENCE=WAREHOUSE, PROPERTY=UDA,  $


Example: Sample Request Using a Level Hierarchy

A report request against a level hierarchy must specify the field name for each generation of the hierarchy required in the report.

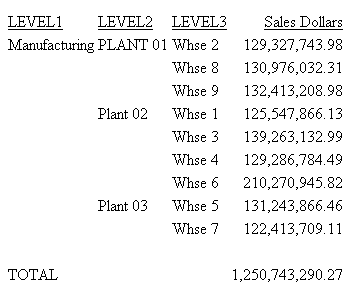
For example, the following request displays the sales dollars measure for generations one through three of the Manufacturing hierarchy:

TABLE FILE CENTSALE
SUM SALES_DOLLARS
BY MANUFACTURING AS 'LEVEL1'
BY PLANT AS 'LEVEL2'
BY WAREHOUSE AS 'LEVEL3'
ON TABLE COLUMN-TOTAL
ON TABLE SET PAGE NOPAGE
ON TABLE SET STYLE *
GRID=OFF, $
END

The output is:

In order to get a total for the entire hierarchy, you have to use an ON TABLE COLUMN-TOTAL command in the request or add another SUM command without a BY phrase (and this would add another column to the report output).


Example: Sample Request Using a Parent/Child Hierarchy

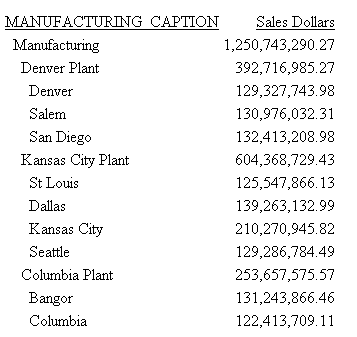
A report request against a parent/child hierarchy can use the BY HIERARCHY phrase to report against the entire hierarchy. The output is automatically formatted with appropriate indentations to show the hierarchy generations and relationships.

For example, the following request shows the sales volume measure for three generations of the Manufacturing2 hierarchy:

TABLE FILE CENTSALE
SUM SALES_DOLLARS
BY MANUFACTURING_CAPTION HIERARCHY 
SHOW TO DOWN 3
ON TABLE SET PAGE NOPAGE
ON TABLE SET STYLE *
GRID=OFF, $
END

The output is:

The report request does not have to reference specific hierarchy generations. The BY HIERARCHY phrase recreates and formats the hierarchy for display. You can also use a WHEN phrase to select a portion of the hierarchy and a SHOW phrase to specify how many levels above and below the selected portion of the hierarchy you want to display. This display format clearly shows the parent/child relationships between the hierarchy members.

In addition, you can specify whether you want the measure values for each parent to represent aggregates for all of its children (full total) or only those selected for display (visual total).

For more information, see Hierarchical Reporting.


Top of page

x
Hierarchical Reporting

How to:

Reference:

When you issue a request against a cube, some of the requirements and features available depend on the type of hierarchy you are reporting against.

With a parent/child hierarchy, you can specify whether the measure values displayed for each parent should show the sum of all of its descendants (full total) or the sum of its displayed descendants (visual total). For level hierarchies, the report always displays full totals, which are the values actually stored in the cube.

For parent/child hierarchies, you can use the BY HIERARCHY phrase to sort and format the hierarchy. You can also limit the portion of the hierarchy selected for display using the WHEN phrase.

When a hierarchical request is processed, the first step is to build the hierarchy and mark which nodes should be included, which should be excluded, and which are needed for context.

The next stage fills the hierarchy with measure values. This stage applies WHERE criteria at the leaf nodes to further qualify the members selected for the report. Dimension properties cannot be used in the initial selection phase of the request, but can be used to screen the selected rows based on dimension data.

Measure values cannot be used to select hierarchy levels for reporting unless the ENGINE ESSBASE RESTRICTSUM OFF setting is in effect. After the hierarchy rows have been selected, screened, and aggregated, WHERE TOTAL tests can limit the rows displayed based on measure values.

It is not currently recommended to use hierarchical reporting with shared members. However, if the ENGINE ESSBASE SUPSHARE ON setting is in effect, a hierarchical report against a hierarchy with shared measures will include any specified shared members, but not members below those shared members.


x
Syntax: How to Display Parent/Child Hierarchies

The following syntax can be used to generate hierarchical reports when the synonym defines parent/child hierarchies:

SUM [FROLL.]measure_field ...
BY hierarchy_field [HIERARCHY [WHEN expression_using_hierarchy_fields;]
[SHOW [TOP|UP n] [TO {BOTTOM|DOWN m}] [byoption [WHEN condition] ...] ]
.
.
.
[WHERE expression_using_dimension_data]
.
.
.
[ON hierarchy_field HIERARCHY [WHEN expression_using_hierarchy_fields;]
[SHOW [TOP|UP n] [TO BOTTOM|DOWN m] [byoption [WHEN condition] ...]]

where:

FROLL

Specifies a full roll-up of the measure. With a full roll-up, the value displayed is the value found in the cube. This value may not reflect the sum of its displayed descendants if some descendants are eliminated from the output based on the WHEN and SHOW options. When FROLL is not specified, the value displayed is a visual total, which means it is the total of the values for its displayed descendants.

Note: If a request uses WHERE criteria to screen out some data, FROLL will not display the value found in the cube. It will display the roll-up of the selected data.

measure_field

Is the field name of a measure.

BY hierarchy_field HIERARCHY

Identifies the hierarchy used for sorting. The field must be a hierarchy field.

ON hierarchy_field HIERARCHY

Identifies the hierarchy used for sorting. The field must be a hierarchy field. The request must include either a BY phrase or a BY HIERARCHY phrase for this field name.

WHEN expression_using_hierarchy_fields;

Selects hierarchy members. The WHEN phrase must immediately follow the word HIERARCHY to distinguish it from a WHEN phrase associated with a BY option (such as SUBFOOT). Any expression using only hierarchy fields is supported. The WHEN phrase can be on the BY HIERARCHY command or the ON HIERARCHY command, but not both.

SHOW

Specifies which levels to show on the report output relative to the levels selected by the WHEN phrase. If there is no WHEN phrase, the SHOW option is applied to the root node of the hierarchy. The SHOW option can be specified on the BY HIERARCHY phrase or the ON HIERARCHY phrase, but not both.

n

Is the number of ascendants above the set of selected members that will have measure values. All ascendants appear on the report to show the hierarchical context of the selected members. However, ascendants that are not included in the SHOW phrase appear on the report with missing data symbols in the report columns that display measures. The default for n is 0.

TOP

Specifies that ascendant levels to the root node of the hierarchy will be populated with measure values.

TO

Is required when specifying a SHOW option for descendant levels.

BOTTOM

Specifies all descendants to the leaf nodes of the hierarchy will be populated with measure values. This is the default value.

m

Is the number of descendants of each selected level that will display. The default for m is BOTTOM, which displays all descendants.

byoption

Is one of the following sort-based options: PAGE-BREAK, REPAGE, RECAP, RECOMPUTE, SKIP-LINE, SUBFOOT, SUBHEAD, SUBTOTAL, SUB-TOTAL, SUMMARIZE, UNDER-LINE. If you specify SUBHEAD or SUBFOOT, you must place the WHEN phrase on the line following the heading or footing text.

condition

Is a logical expression.

expression_using_dimension_data

Screens the rows selected in the BY/ON HIERARCHY and WHEN phrases based on dimension data. The expression can use dimension properties, measures (with RETRICTSUM OFF), and hierarchy fields; however, the selection criteria are always applied to the values at the leaf nodes. Therefore, you cannot use WHERE to select rows based on hierarchy field values that occur at higher levels. For example, in a dimension with Continents, Countries, and Cities, your request will not display any rows if you use WHERE to select a Country name, but it may if you use it to select a City name.

The following examples illustrate hierarchical reporting using the BY HIERARCHY phrase.


Example: Reporting on a Whole Hierarchy

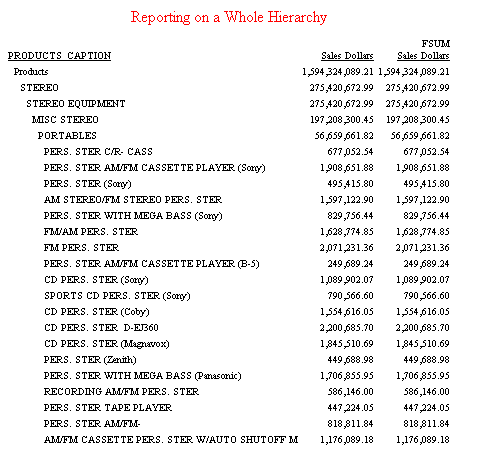
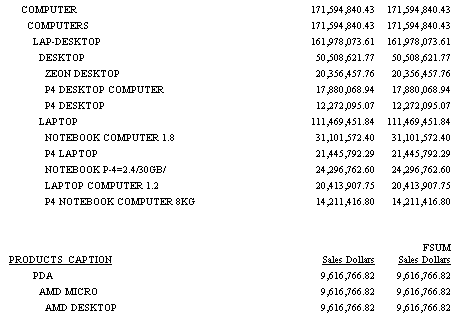
The following request produces visual totals (SALES_DOLLARS) and full totals (FROLL.SALES_DOLLARS). The BY HIERARCHY phrase specifies hierarchical reporting. There is no WHEN phrase to limit the portion of the hierarchy displayed. Also note that the full roll-up is displayed with the prefix FSUM added to the field name. The full total is the same as the visual total for a report on the entire hierarchy:

TABLE FILE CENTSALE
WRITE SALES_DOLLARS FROLL.SALES_DOLLARS 
BY PRODUCTS_CAPTION HIERARCHY 
ON TABLE SET PAGE NOPAGE
ON TABLE SUBHEAD
"Reporting on a Whole Hierarchy"
ON TABLE SET STYLE *
TYPE=REPORT, SIZE=8,$
TYPE=REPORT, GRID=OFF, WRAP=OFF, $
TYPE=TABHEADING, SIZE=10, COLOR=RED, JUSTIFY=CENTER, $
END

The top portion of the hierarchy is:
The bottom portion of the hierarchy is:


Example: Selecting a Hierarchy Member

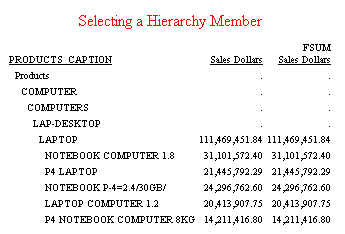
The following request produces a visual total and full total for the Products2 hierarchy of the Products dimension, but limits the members selected for display with the WHEN phrase. Note that the hierarchy member selected is displayed in its context (all ancestors to the root of the hierarchy). However, the ancestors are not requested in the report and are, therefore, displayed with missing data symbols. All descendants of the selected members appear in the report output because the default SHOW option for descendants is BOTTOM:

TABLE FILE CENTSALE
WRITE SALES_DOLLARS FROLL.SALES_DOLLARS  
BY PRODUCTS_CAPTION HIERARCHY
WHEN PRODUCTS_CAPTION EQ 'LAPTOP'; 
ON TABLE SET PAGE NOPAGE
ON TABLE SUBHEAD
"Selecting a Hierarchy Member"
ON TABLE SET STYLE *
TYPE=REPORT, SIZE=8,$
TYPE=REPORT, GRID=OFF, WRAP=OFF, $
TYPE=TABHEADING, SIZE=10, COLOR=RED, JUSTIFY=CENTER, $
END

The output is:


Example: Selecting a Member and Adding a Parent

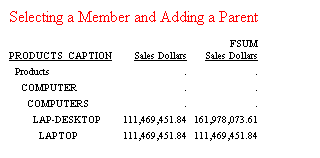
In the following request, the SHOW option UP 1 TO DOWN 0 added to the WHEN phrase adds the parent (LAP-DESKTOP) of the selected member (LAPTOP). This parent now contains values for the measures rather than missing data symbols. However, the full total column for the parent contains the sum of all of its descendants, not just the selected LAPTOP member, while the visual total shows the total only for the LAPTOP member:

TABLE FILE CENTSALE
WRITE SALES_DOLLARS FROLL.SALES_DOLLARS 
BY PRODUCTS_CAPTION HIERARCHY
WHEN PRODUCTS_CAPTION EQ 'LAPTOP'; 
SHOW UP 1 TO DOWN 0 
ON TABLE SET PAGE NOPAGE
ON TABLE SUBHEAD
"Selecting a Member and Adding a Parent"
ON TABLE SET STYLE *
TYPE=REPORT, SIZE=8,$
TYPE=REPORT, GRID=OFF, WRAP=OFF, $
TYPE=TABHEADING, SIZE=10, COLOR=RED, JUSTIFY=CENTER, $
END

The output is:


Example: Selecting a Member and Adding Children

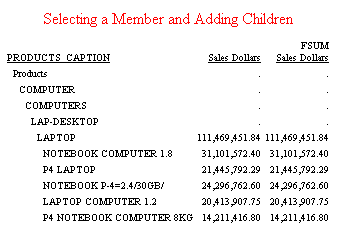
In the following request, the SHOW option UP 0 TO DOWN 1 added to the WHEN phrase adds the children of the selected member (LAPTOP). Because no children of the selected member are excluded, and no higher level members are in the SHOW set, the full and visual totals are the same:

TABLE FILE CENTSALE
WRITE SALES_DOLLARS FROLL.SALES_DOLLARS 
BY PRODUCTS_CAPTION HIERARCHY
WHEN PRODUCTS_CAPTION EQ 'LAPTOP'; 
SHOW UP 0 TO DOWN 1  
ON TABLE SET PAGE NOPAGE
ON TABLE SUBHEAD
"Selecting a Member and Adding Children"
ON TABLE SET STYLE *
TYPE=REPORT, SIZE=8,$
TYPE=REPORT, GRID=OFF, WRAP=OFF, $
TYPE=TABHEADING, SIZE=10, COLOR=RED, JUSTIFY=CENTER, $
END

The output is:


Example: Selecting a Member and Showing All Ascendants

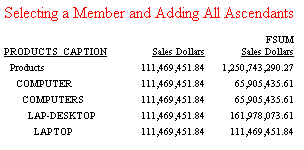
In the following request, the SHOW option TOP TO DOWN 0 added to the WHEN phrase adds all ascendants but no descendants of the selected member (LAPTOP). These parents now contain values for the measures rather than missing data symbols. However, the full total column for the ascendants contains the sum of all of their descendants, not just the specified LAPTOP member, while the visual total shows the total for only the LAPTOP member:

TABLE FILE CENTSALE
WRITE SALES_DOLLARS FROLL.SALES_DOLLARS 
BY PRODUCTS_CAPTION HIERARCHY
WHEN PRODUCTS_CAPTION EQ 'LAPTOP'; 
SHOW TOP TO DOWN 0  
ON TABLE SET PAGE NOPAGE
ON TABLE SUBHEAD
"Selecting a Member and Adding All Ascendants"
ON TABLE SET STYLE *
TYPE=REPORT, SIZE=8,$
TYPE=REPORT, GRID=OFF, WRAP=OFF, $
TYPE=TABHEADING, SIZE=10, COLOR=RED, JUSTIFY=CENTER, $
END

The output is:


Example: Selecting a Member and Showing All Ascendants and Descendants

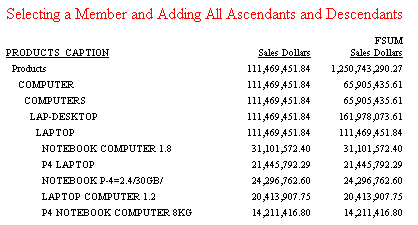
In the following request, the SHOW option TOP added to the WHEN phrase adds all ascendants and descendants (since TO BOTTOM is the default) of the selected member (LAPTOP). These parents are now in the SHOW set and contain values for the measures rather than missing data symbols. However, the full total column for the ascendants contains the sums of all of their descendants, not just the specified LAPTOP member, while the visual total shows the total for only the LAPTOP member:

TABLE FILE CENTSALE
WRITE SALES_DOLLARS FROLL.SALES_DOLLARS 
BY PRODUCTS_CAPTION HIERARCHY
WHEN PRODUCTS_CAPTION EQ 'LAPTOP'; 
SHOW TOP  
ON TABLE SET PAGE NOPAGE
ON TABLE SUBHEAD
"Selecting a Member and Adding All Ascendants and Descendants"
ON TABLE SET STYLE *
TYPE=REPORT, SIZE=8,$
TYPE=REPORT, GRID=OFF, WRAP=OFF, $
TYPE=TABHEADING, SIZE=10, COLOR=RED, JUSTIFY=CENTER, $
END

The output is:


Example: Selecting Members for Display and Screening on Member Values

You use the WHEN phrase to select hierarchy members to display on the report. Each of the selected members is displayed in its context. The ascendants of selected members display missing data symbols. When a request is processed, the first step is to build the hierarchy and mark which nodes should be included, which should be excluded, and which are needed for context but should display missing data symbols according to the WHEN phrase.

The next stage fills the hierarchy with measure values. This stage applies WHERE criteria (which must select on the lowest level of the hierarchy or the report will be empty).

If a WHERE is specified without a WHEN, no nodes are marked as excluded, so no nodes display missing values.

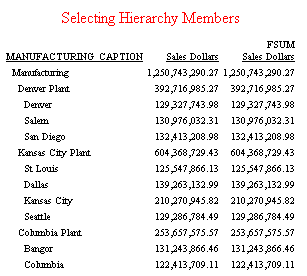
The following request shows the Manufacturing2 hierarchy:

TABLE FILE CENTSALE
WRITE SALES_DOLLARS FROLL.SALES_DOLLARS  
BY MANUFACTURING_CAPTION HIERARCHY  
ON TABLE SET PAGE NOPAGE
ON TABLE SUBHEAD
"Selecting Hierarchy Members"
ON TABLE SET STYLE *
TYPE=REPORT, SIZE=8,$
TYPE=REPORT, GRID=OFF, WRAP=OFF, $
TYPE=TABHEADING, SIZE=10, COLOR=RED, JUSTIFY=CENTER, $
END

The output is:
The following request selects the portion of the hierarchy whose members contain the value Plant or City. It then screens on the dimension attribute WHSE_MANAGEMENT equal to Leased or Owned. This WHERE screening condition does not affect the portion of the hierarchy that was selected by WHEN, but it does not display or include in the totals those rows that had no data meeting the WHERE condition:

TABLE FILE CENTSALE
WRITE SALES_DOLLARS FROLL.SALES_DOLLARS 
BY MANUFACTURING_CAPTION HIERARCHY  
WHEN MANUFACTURING_CAPTION CONTAINS 'City' OR 'Plant';
WHERE WHSE_MANAGEMENT EQ 'Leased' OR 'Owned' 
ON TABLE SET PAGE NOPAGE
ON TABLE SUBHEAD
"Selecting Members and Screening Data Values"
ON TABLE SET STYLE *
TYPE=REPORT, SIZE=8,$
TYPE=REPORT, GRID=OFF, WRAP=OFF, $
TYPE=TABHEADING, SIZE=10, COLOR=RED, JUSTIFY=CENTER, $
END

The output is:
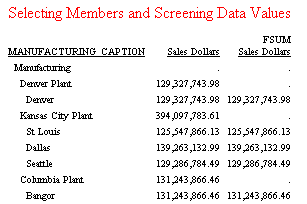
Note that the full total is a value taken directly from the data source. It must pass both the WHEN and WHERE conditions in order to be retrieved and, therefore, is represented by a missing value in some rows. The visual total is calculated starting from the leaf nodes, so it is present for higher levels even if a higher level record does not pass the WHERE condition.


Example: Comparing Member Selection With Data Screening

The following request selects hierarchy members whose captions contains the value Plant and, from those selected members, screens values at the lowest level of the hierarchy for captions containing City:

TABLE FILE CENTSALE
WRITE SALES_DOLLARS FROLL.SALES_DOLLARS 
BY MANUFACTURING_CAPTION HIERARCHY  
WHEN MANUFACTURING_CAPTION CONTAINS 'Plant';
WHERE MANUFACTURING_CAPTION CONTAINS 'City'  
ON TABLE SET PAGE NOPAGE
ON TABLE SUBHEAD
"Comparing Member Selection With Data Screening"
ON TABLE SET STYLE *
TYPE=REPORT, SIZE=8,$
TYPE=REPORT, GRID=OFF, WRAP=OFF, $
TYPE=TABHEADING, SIZE=10, COLOR=RED, JUSTIFY=CENTER, $
END

The output is:
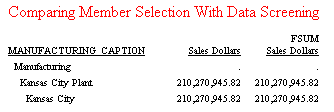
Note that the WHERE condition removes all leaf nodes except Kansas City from the hierarchy display and from the totals.


Example: Reporting on Shared Members

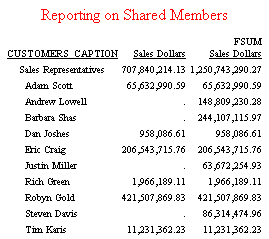
The following request sets SUPSHARE ON and reports on the Customers2 hierarchy, which has shared members. The WHERE TOTAL test screens on the measure SALES_DOLLARS to remove rows with zero sales dollars. No members below the shared members display on the report output:

ENGINE ESSBASE SET SUPSHARE ON
TABLE FILE CENTSALE
WRITE SALES_DOLLARS FROLL.SALES_DOLLARS
BY CUSTOMERS_CAPTION HIERARCHY 
WHEN CUSTOMERS_CAPTION CONTAINS 'Rep'; 
SHOW TO BOTTOM
WHERE TOTAL SALES_DOLLARS NE 0; 
ON TABLE SET PAGE NOPAGE
ON TABLE SUBHEAD
"Reporting on Shared Members"
ON TABLE SET STYLE *
TYPE=REPORT, SIZE=8,$
TYPE=REPORT, GRID=OFF, WRAP=OFF, $
TYPE=TABHEADING, SIZE=10, COLOR=RED, JUSTIFY=CENTER, $
END

The output is:


Example: Using SHOW Without WHEN

The following request does not contain a WHEN phrase, so the SHOW option DOWN TO 0 applies to the root node (as if there had been a WHEN phrase that selected only the root node). Therefore, the root level is the only one shown on the report output:

TABLE FILE CENTSALE
WRITE SALES_DOLLARS FROLL.SALES_DOLLARS
BY PRODUCTS_CAPTION HIERARCHY 
SHOW TO DOWN 0 
ON TABLE SET PAGE NOPAGE
ON TABLE SUBHEAD
"SHOW Without WHEN"
ON TABLE SET STYLE *
TYPE=REPORT, SIZE=8,$
TYPE=REPORT, GRID=OFF, WRAP=OFF, $
TYPE=TABHEADING, SIZE=10, COLOR=RED, JUSTIFY=CENTER, $
END

The output is:


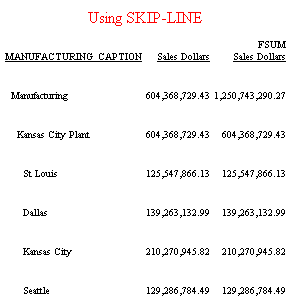
Example: Using SKIP-LINE

The following request adds the BY option SKIP-LINE to the BY HIERARCHY phrase:

TABLE FILE CENTSALE
WRITE SALES_DOLLARS FROLL.SALES_DOLLARS 
BY MANUFACTURING_CAPTION HIERARCHY 
WHEN MANUFACTURING_CAPTION CONTAINS 'City'; 
SHOW UP 1 TO DOWN 1 SKIP-LINE  
ON TABLE SET PAGE NOPAGE
ON TABLE SUBHEAD
"Using SKIP-LINE"
ON TABLE SET STYLE *
TYPE=REPORT, SIZE=8,$
TYPE=REPORT, GRID=OFF, WRAP=OFF, $
TYPE=TABHEADING, SIZE=10, COLOR=RED, JUSTIFY=CENTER, $
END

The output is:


Example: Using Conditional Sort Options

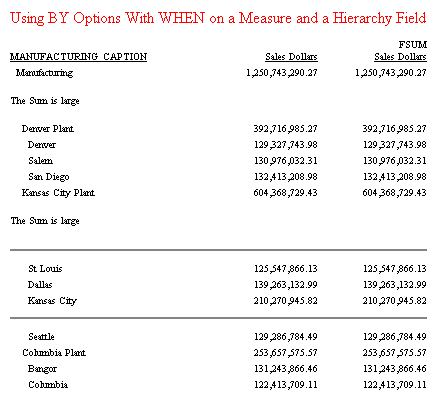
The following request has a BY HIERARCHY command with a WHEN phrase to select members as well as a WHEN phrase to control the UNDER-LINE option.

The SUBFOOT option is in an ON phrase that references the same hierarchy field (all of the BY options could have been on the BY HIERARCHY phrase).

Each BY option has its own WHEN phrase. The WHEN phrase for the SUBFOOT option uses a measure field in its expression. The WHEN phrase for the UNDER-LINE option uses a hierarchy field in its expression. Attribute fields are not supported in WHEN phrases. They can only be used in IF or WHERE tests.

In this example, one BY option is activated WHEN the MANUFACTURING_CAPTION contains City. The other BY option creates a subfoot WHEN SALES_DOLLARS is greater than or equal to $600,000,000:

TABLE FILE CENTSALE
WRITE SALES_DOLLARS FROLL.SALES_DOLLARS
BY MANUFACTURING_CAPTION HIERARCHY
WHEN MANUFACTURING_CAPTION CONTAINS 'Plant' ;
SHOW TOP UNDER-LINE WHEN MANUFACTURING_CAPTION CONTAINS 'City'; 
ON MANUFACTURING_CAPTION SUBFOOT 
" "
"The Sum is large"
" " 
WHEN SALES_DOLLARS GE 600000000; 
ON TABLE SUBHEAD
"Using BY Options With WHEN on a Measure and a Hierarchy Field"
ON TABLE SET PAGE NOPAGE
ON TABLE SET STYLE *
TYPE=REPORT, SIZE=8,$
TYPE=REPORT, GRID=OFF, WRAP=OFF, $
TYPE=TABHEADING, SIZE=10, COLOR=RED, JUSTIFY=CENTER, $
END

The output is:


Example: Using Two BY HIERARCHY Phrases

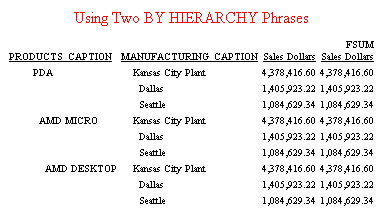
The following request has a BY HIERARCHY phrase for the Products2 hierarchy and a second BY HIERARCHY phrase for the Manufacturing2 hierarchy (which is from a different dimension, as required). All selected members for the Manufacturing2 hierarchy are repeated for each selected member of the Products2 hierarchy. The WHERE TOTAL phrase omits rows in which SALES_DOLLARS is less than $1,000,000:

TABLE FILE CENTSALE
WRITE SALES_DOLLARS FROLL.SALES_DOLLARS  
BY PRODUCTS_CAPTION HIERARCHY 
WHEN PRODUCTS_CAPTION EQ 'PDA'; 
BY MANUFACTURING_CAPTION HIERARCHY 
WHEN MANUFACTURING_CAPTION CONTAINS 'City';
WHERE TOTAL SALES_DOLLARS GE 1000000;
ON TABLE SET PAGE NOPAGE
ON TABLE SUBHEAD
"Using Two BY HIERARCHY Phrases"
ON TABLE SET STYLE *
TYPE=REPORT, SIZE=8,$
TYPE=REPORT, GRID=OFF, WRAP=OFF, $
TYPE=TABHEADING, SIZE=10, COLOR=RED, JUSTIFY=CENTER, $
END

The output is:


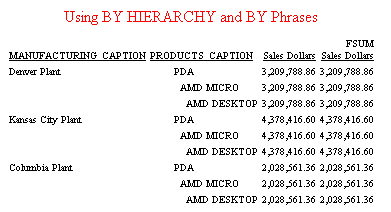
Example: Using BY HIERARCHY and BY Phrases

The following request has a BY phrase for the Manufacturing2 hierarchy and a BY HIERARCHY phrase for the Products2 hierarchy. All selected members for the Products2 hierarchy are repeated for each selected member of the Manufacturing2 hierarchy (which is not displayed with hierarchical indentations when referenced in a BY phrase). A BY on a unique field is required. Therefore, there is one BY on a unique field with the NOPRINT option and another BY on the caption field:

TABLE FILE CENTSALE
WRITE SALES_DOLLARS FROLL.SALES_DOLLARS  
BY MANUFACTURING_MEMBER NOPRINT
BY MANUFACTURING_CAPTION 
BY PRODUCTS_CAPTION HIERARCHY 
WHEN PRODUCTS_CAPTION EQ 'PDA';
WHERE MANUFACTURING_CAPTION CONTAINS 'Plant';
WHERE TOTAL SALES_DOLLARS GE 1000000;
ON TABLE SET PAGE NOPAGE
ON TABLE SUBHEAD
"Using BY HIERARCHY and BY Phrases"
ON TABLE SET STYLE *
TYPE=REPORT, SIZE=8,$
TYPE=REPORT, GRID=OFF, WRAP=OFF, $
TYPE=TABHEADING, SIZE=10, COLOR=RED, JUSTIFY=CENTER, $
END

The output is:


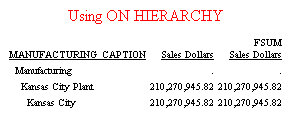
Example: Using ON HIERARCHY Without BY HIERARCHY

The following request has a BY phrase and an ON HIERARCHY phrase for the Manufacturing2 hierarchy. All hierarchy options and BY options are supported on the ON HIERARCHY phrase. This request also has a WHERE clause that selects rows based on the value of a hierarchy field (MANUFACTURING_CAPTION). The WHERE test selects rows based on values at the leaf nodes:

TABLE FILE CENTSALE
WRITE SALES_DOLLARS FROLL.SALES_DOLLARS  
BY MANUFACTURING_CAPTION 
ON MANUFACTURING_CAPTION HIERARCHY  
WHEN MANUFACTURING_CAPTION CONTAINS 'Plant'; 
WHERE MANUFACTURING_CAPTION CONTAINS 'City'; 
ON TABLE SET PAGE NOPAGE
ON TABLE SUBHEAD
"Using ON HIERARCHY"
ON TABLE SET STYLE *
TYPE=REPORT, SIZE=8,$
TYPE=REPORT, GRID=OFF, WRAP=OFF, $
TYPE=TABHEADING, SIZE=10, COLOR=RED, JUSTIFY=CENTER, $
END

The output is:


x
Reference: Hierarchical Reports With Multiple Display Commands

In a request with more than one display command, each command must repeat all of the sort phrases from the previous command in the same order after which additional sort phrases can be added. In a hierarchical reporting request, the following rules must be followed:


Example: Using Multiple Display Commands in a Hierarchical Report

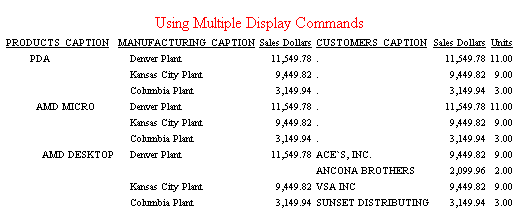
The following request has two WRITE commands. The first WRITE command has a BY HIERARCHY sort phrase for the Products2 hierarchy and a BY HIERARCHY phrase for the Manufacturing2 hierarchy. The second WRITE command repeats these phrases and adds a BY phrase for the Customers2 hierarchy:

TABLE FILE CENTSALE 
WRITE SALES_DOLLARS
BY PRODUCTS_CAPTION HIERARCHY 
WHEN PRODUCTS_CAPTION EQ 'PDA';
SHOW TO DOWN 0 
BY MANUFACTURING_CAPTION HIERARCHY 
WHEN MANUFACTURING_CAPTION CONTAINS 'Plant';
SHOW TO DOWN 0 
WRITE SALES_DOLLARS UNITS
BY PRODUCTS_CAPTION HIERARCHY
BY MANUFACTURING_CAPTION HIERARCHY
BY CUSTOMERS_CAPTION 
WHERE CUSTOMERS_MEMBER LIKE '01%'
WHERE TOTAL SALES_DOLLARS NE 0 
 
ON TABLE SET PAGE NOPAGE
ON TABLE SUBHEAD
"Using Multiple Display Commands"
ON TABLE SET STYLE *
TYPE=REPORT, SIZE=8,$
TYPE=REPORT, GRID=OFF, WRAP=OFF, $
TYPE=TABHEADING, SIZE=10, COLOR=RED, JUSTIFY=CENTER, $
END

The BY HIERARCHY phrase for the Products2 hierarchy has a WHEN phrase that selects members whose caption is PDA. The SHOW option (TO DOWN 2) displays two levels of descendants below the PDA level.

For the Manufacturing2 hierarchy, the selected members have the characters Plant in their captions. The SHOW option displays no descendants on the report output. All selected members of the Manufacturing2 hierarchy display for each selected member of the Products2 hierarchy.

The WHERE TOTAL test removes all rows with zero SALES_DOLLARS from the report output. The WHERE test selects customers whose member values begin with 01.

The output is:


Top of page

x
Columnar Reporting

How to:

Reference:

If you run a standard TABLE or FML report against a cube, you are running what is known as a columnar report. A columnar report flattens out the multi-dimensional structure of a cube to show information from one angle.

To create a valid columnar report, you must understand the data structure of the cube and the logic and assumptions that the adapter uses when retrieving values from a cube.

The adapter has built-in logic that enables it to determine the rows and cells to extract from rollups in order to deliver reports. TABLE uses the lowest level BY phrase for each dimension to determine at which rollup to locate the lookup for aggregations. It then rolls the result up from there, performing aggregations on the data as needed to ensure the consistency of the results.

If you do not specify a BY field in your TABLE request, you may receive invalid data or a message. This happens because without a BY field to determine the level of rollup at which to perform the data lookup, TABLE does not know where to source the result. At least one BY phrase (perhaps with the NOPRINT option) must be on a field with unique values.


x
Reference: Reporting on Measures

The Essbase Server does not support the use of SUM or PRINT on an Measure without reference to another dimension in the request.

For example, since this request refers only to measure,

TABLE FILE BASIC
PRINT DATA_VALUE
END

the following message displays:

(FOC43244) No active dimension found in the request.


x
Reference: Columnar Reporting on a Parent/Child View

You cannot reference PARENT or PARENTCAP from the parent/child view without referencing MEMBER or CAPTION, unless you are using it as a filter.


Example: Referencing MEMBER and CAPTION Attributes

The following request is incorrect since it does not reference MEMBER or CAPTION.

TABLE FILE BASIC
PRINT DATA_VALUE
BY PRODUCT_PARENT
WHERE PRODUCT_PARENT EQ 'Visual'
END

The following message displays:

(FOC43248) Can't reference PRODUCT's PARENT,PARENTCAP without MEMBER or 
CAPTION.

The correct request is:

TABLE FILE BASIC
PRINT DATA_VALUE
BY PRODUCT_PARENT
BY PRODUCT_MEMBER
WHERE PRODUCT_PARENT EQ 'Visual'
END

The output is:
PRODUCT_PARENT    PRODUCT_MEMBER        DATA_VALUE
---------------   ---------------       ----------
Visual            Camera                 20,971.00
                  Television             27,877.00
                  VCR                    49,206.00

You cannot reference fields from the Generation view (GEN1_PRODUCT or GEN2_PRODUCT) and from the parent/child view (PRODUCT_MEMBER or PRODUCT_CAPTION) in one request if the fields from these different views are from the same dimension.

For example, in the following request

TABLE FILE BASIC
PRINT DATA_VALUE
BY PRODUCT_MEMBER
BY FAMILY
WHERE PRODUCT_MEMBER EQ 'Visual'
END

FAMILY is a member of the Product dimension and part of the Generation view so the following message is generated:

(FOC43247) Can't reference fields from Product2 and Product at the same 
time.

The correct request is:

TABLE FILE BASIC
PRINT DATA_VALUE
BY PRODUCT_MEMBER
BY SCENARIO
WHERE PRODUCT_MEMBER EQ 'Visual'
END

The output is:
PRODUCT_MEMBER  SCENARIO     DATA_VALUE
--------------  --------     ----------
Camera          Scenario      20,971.00
Television      Scenario      27,877.00
VCR             Scenario      49,206.00


x
Syntax: How to Collapse PRINT With ACROSS

The PRINT command generates a report that has a single line for each record retrieved from the data source after screening out those that fail IF or WHERE tests. When PRINT is used in conjunction with an ACROSS phrase, many of the generated columns may be empty. Those columns display the missing data symbol.

To avoid printing such a sparse report, you can use the SET ACROSSPRT command to compress the lines in the report. The number of lines is reduced within each sort group by swapping non-missing values from lower lines with missing values from higher lines, and then eliminating any lines whose columns all have missing values.

Because data may be moved to different report lines, row-based calculations such as ROW-TOTAL and ACROSS-TOTAL in a compressed report are different from those in a non-compressed report. Column calculations are not affected by compressing the report lines.

The syntax is

SET ACROSSPRT = {NORMAL|COMPRESS}
ON TABLE SET ACROSSPRT {NORMAL|COMPRESS}

where:

NORMAL

Does not compress report lines.

COMPRESS

Compresses report lines by promoting data values up within a sort group.


Example: Compressing Report Output

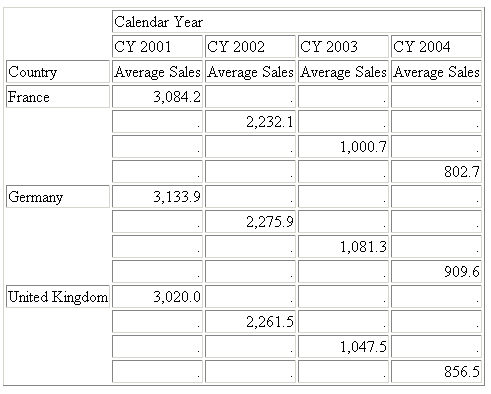
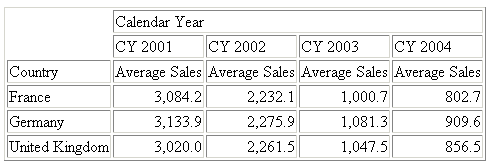
The following request against the Adventure Works cube prints average sales by country across calendar year:

TABLE FILE ADVENTURE_WORKS 
PRINT INTERNET_AVERAGE_SALES_AMOUNT/D8.1 AS 'Average Sales'
BY COUNTRY51 
ACROSS CALENDAR_YEAR4 
WHERE COUNTRY51 EQ 'France' OR 'Germany' OR 'United Kingdom' 
ON TABLE SET ACROSSPRT NORMAL 
ON TABLE SET PAGE-NUM OFF
END 

Each line of the report output represents one value of average sales for one year, so at most one column on each line has a value when ACROSSPRT is set to NORMAL (the default). The output is:

Running the same request with ACROSSPRT=COMPRESS moves data values from lower lines to higher lines within the same BY group and eliminates lines that have all missing values:

TABLE FILE ADVENTURE_WORKS 
PRINT INTERNET_AVERAGE_SALES_AMOUNT/D8.1 AS 'Average Sales'
BY COUNTRY51 
ACROSS CALENDAR_YEAR4 
WHERE COUNTRY51 EQ 'France' OR 'Germany' OR 'United Kingdom' 
ON TABLE SET ACROSSPRT COMPRESS 
ON TABLE SET PAGE-NUM OFF
END 

The output is:

Top of page

x
Full and Partial Aggregation

Reference:

Cube requests are requests that reference at least one measure and possibly more than one hierarchy. Attributes may also be referenced.

For cube requests, the adapter reads cells with fully or partially aggregated data from the cube and applies certain restrictions on the contents of the TABLE request to ensure consistency of reports.

There are two modes in which cube requests are processed: Full Aggregation and Partial Aggregation.

Full aggregation mode is more efficient because no aggregation is needed beyond what is already stored in the cube.


x
Reference: Support for Full Aggregation Mode

The following table describes support for full aggregation mode:

Command

Dimension Properties

Measures

Attributes

WRITE/ SUM/ADD

Supported, converted to FST.

Supported, converted to an operation that matches the measure aggregator.

Not supported.

COMPUTE

Supported.

Supported.

Not supported.

PRINT

Supported.

Supported for compatibility. Not supported with BY HIERARCHY.

Not supported.

WHERE TOTAL

Supported

Supported

Not supported.

WHERE

Supported

Supported with RESTRICTSUM.

Required for attributes. Must provide required restriction for its variable selection type. Restricted to a group of fields that represent a single attribute.

WHEN

Supported

Not supported.

Not supported.

DEFINE

Supported

Supported with RESTRICTSUM.

Not supported.

BY

Supported. Requires BY on a unique field of a parent/ child hierarchy (except when referenced only in a WHERE). BY HIERARCHY adds BY internally.

Not supported.

Not supported.

BY HIERARCHY

Supported.

Not supported.

Not supported.

ON HIERARCHY

Supported. Requires a corresponding BY or BY HIERARCHY phrase.

Not supported.

Not supported.


x
Reference: Support for Partial Aggregation Mode

In partial aggregation mode, there are additional restrictions on the use of measures. Note that in requests with multiple display commands, the partial aggregation restrictions apply to all display commands except for the ones associated with the lowest BY phrase:

The following factors turn on partial aggregation mode:


Top of page

x
Reporting Rules

Reference:

The reporting rules and features vary depending on the types of hierarchies defined in the synonym. These factors are summarized in the following sections.


x
Reference: Display Command and Prefix Operator Support

When BY HIERARCHY is not used in the request, the display command can be PRINT, even for aggregated data. It is internally converted to the appropriate command.

Note: To emphasize that the summary values are already in the cube and do not necessarily require any additional aggregation, the examples use the WRITE command, which is a synonym for SUM.

The measure operation is also automatically supplied internally; you do not have to specify a prefix operator in the request. However, if you do specify a prefix operator, it should match the measure aggregator.

Prefix operators in a request have an effect in two situations. You can use the FROLL prefix operator to specify a full total in a BY HIERARCHY request. Also, requests with multiple display commands (and sort groups) use the prefix operator to determine the sort order of the high level sort groups.


x
Reference: Reporting Rules for All Hierarchies

BY. Lexicographic sort is available on any of the member properties as well as expressions (DEFINEs) based on properties, but the request must include a sort (possibly with the NOPRINT option) on a property that is guaranteed to uniquely identify a hierarchy member, either PROPERTY=UID or PROPERTY=NAME. BY HIERARCHY automatically adds a BY one of these properties. In a report referencing a level hierarchy, the request must specify one.

Hierarchies. Only one hierarchy from the same dimension can be represented on the report.

Measures. Filtering on totals is done using WHERE or WHERE TOTAL tests. Calculations on totals are done using DEFINE or COMPUTE (RESTRICTSUM ON).

Screening. Screening on member properties is available with and without sorting.

Joins. The adapter does not support direct JOINs from or to a cube. Therefore, SQL joins using a WHERE clause are not supported. To achieve a joined request, use the WebFOCUS MATCH FILE command or create a HOLD file and use the HOLD file in the request.


x
Reference: Reporting Rules for Parent/Child Hierarchies

BY HIERARCHY. Requires the command SUM, WRITE, or ADD. PRINT is not supported.

Hierarchical Context. The set of members selected for the report using a WHEN test is augmented so that every member of the hierarchy is shown within its hierarchical context. The displayed subtree of hierarchy members is a contiguous tree whose root is the root of the whole hierarchy. The added context members are shown without totals.

Report Compression. By default, hierarchy members with no fact data do not participate in the report. Hierarchy members for which no data passes screening do not participate in the report. In a multi-hierarchy report, the inner hierarchies are not shown for those members of outer hierarchies that appear on the report output only to show the context of selected members.

Full and visual totals. Visual totals for each node are composed from the totals of its hierarchical children shown on the same report. These are compatible with the totals shown for the same members in a multi-verb level-wise report. Visual totals are the default. The report can specify full totals by specifying the prefix operator FROLL on a measure field. Full totals are accumulated for each displayed hierarchy member individually. These are compatible with the totals shown for the same members in a non-hierarchical report on a parent-child hierarchy.


Top of page

x
General Tips for Reporting

When creating a report request:

PRINT and SUM can be used interchangeably when using level hierarchies.

To maximize reporting efficiency, always sort in the same direction as the hierarchy for the cube. For example, if the hierarchy for a dimension is

Country > State_Province > City

sorting by City first, then State_Province results in an inefficient request. Also, because of the hierarchical structure of OLAP, you retrieve only one BY field for each SUM or PRINT field in the report.


WebFOCUS