Resource Governor Report Options

In this section:

There is general information that applies to all Resource Governor reports. This information includes setting date ranges for report selection criteria, online help, drilling down on reports for more details, and displaying reports in graphical format.


Top of page

x
Selection Criteria

How to:

Before you execute a report, you can select the date range of usage monitoring data to include along with other criteria used in the report. To specify these options, right-click the report you want to run and select Run.

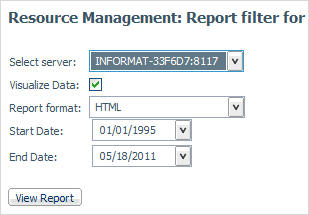
The Report Filter window opens, as shown in the following image. By default, the Visualize Data checkbox is checked, indicating Data Visualization is ON, the Report format is set for HTML, and the default date in the End date input box is today's date. The default date in the Start date input box is January 1, 1995.

The Report Preferences window opens as shown in the following image. By default, the Visualize Data checkbox is checked, indicating Data Visualization is ON, the Report format is set for HTML, and the Use Today's Date checkbox is checked, indicating that the default date in the End date input box is today's date. The default date in the Start date input box is January 1, 1995.

The information you supply here will apply to any report you run. To change this information, return to this screen by running another report and changing the filters.

Resource Governor report selection criteria information is saved from session to session, so you will not need to reset it when you re-connect to the server.


x
Procedure: How to Turn Off Data Visualization

You have the option of turning off Data Visualization when displaying reports. By default, the Visualize Data checkbox is checked, indicating that Data Visualization is ON.

To turn off data visualization:

  1. Uncheck the Visualize Data checkbox.
  2. Click View Report.


x
Procedure: How to Format a Report

To change the report format:

  1. Click the Report format drop-down menu.

    The following image shows all of the report options available. If you are licensed for active reports, you can choose that as your report format. For more information on active reports, see the WebFOCUS Managed Reporting End User's Manual.
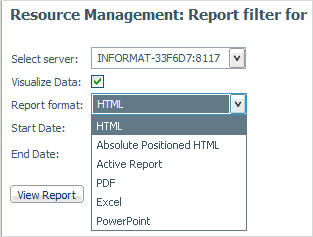
  2. Select a report format from the drop-down menu. The following options are available:
    • HTML
    • Absolute Positioned HTML
    • active report
    • PDF
    • Excel
    • PowerPoint
  3. Click View Report.


x
Procedure: How to Set Selection Criteria Dates for Reports

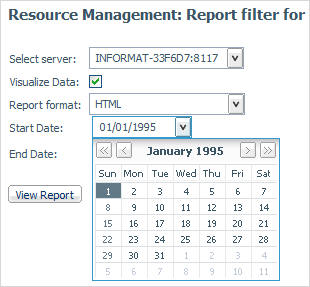
By default, January 1, 1995 appears in the Start Date input box and today's date appears in the End Date input box. You may change these values by typing directly into the boxes, or by selecting dates from a pop-up calendar. The earliest start date you can enter is January 1, 1970. If you enter an earlier date it will automatically be changed to today's date. To set selection criteria dates for reports:

  1. Type a date into the date input box on the left (Start Date).

    or

    Click the drop-down arrow that appears to the right of the date input box.

    A calendar appears from which you can choose the month, day, and year for the Start date of the Usage Monitoring data on which you want to report.

  2. Type a date into the End Date input box or select a date from the pop-up calendar. If no date is selected, today’s date will be used by default.
  3. Click View Report.

Top of page

x
Online Help

When you run Resource Governor Reports you have an online help feature at your disposal, accessible through the ? Help button in the report window. The online help provides background information about the report you are running.

For more information about Resource Governor's help features, see Getting Help.


Top of page

x
Drilling Down With Reports

When you execute Resource Governor reports, initially, you will usually see a general summary report for the category. Most of the column headings of the reports are hyperlinked. Click the column heading links to re-sort the report by different columns. In addition, other hyperlinks in the report let you drill down to more detailed information. These hyperlinked drill-down options are described in more detail throughout this chapter.

The sections below describe the individual reports. Some of these sections contain a table of drill-down links. In the tables of drill-down links, terms shown in italic represent placeholders, indicating the term can have different values, depending on the selections for that report.


Top of page

x
Monitor Preference and Reports

If you change the Monitor Preference setting and do not collect all the information, some reports will have missing data. When those reports are executed, the following message appears:

This report is not available due to monitor preference. To enable this
report contact your administrator and request that ALL DATA level
granularity be enabled in Resource Governor and/or Resource Governor.

Top of page

x
Alternate Reporting Output

Many Resource Governor reports can be output in both tabular and graphical formats. Reports can also be reformatted into a number of different outputs.

Reports initially appear in the format specified by the Report format in the Resource Management: Report Filters window.

To reformat a report, click the Reformat link located on the upper left of the report page.

The Reformat As window opens, as shown in the following image. The window contains a Select Format drop-down menu, allowing you to choose a helper application in order to display reports in a variety of formats. The format that you select will be used on any drill-down reports. Reports run from the tree will use the Report format set in the Resource Management: Report Filter window.

Reformat As Window


WebFOCUS