In this section: |
Performance Analysis Reports are designed to help reduce excessive overhead. They help identify costly requests and unused data sources that may need to be reviewed to determine if the resource or storage usage could be reduced.
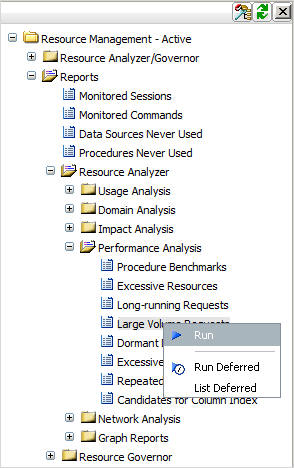
To access Performance Analysis reports in the Web Console, click Resource Management on the toolbar and expand the Reports and Resource Analyzer folders. Expand the Performance Analysis folder. Right-click the desired report, and select Run from the context menu, as shown in the following image.
The following reports are available:
For more information on the resource and performance analysis issues related to the Resource and Performance Analysis Reports, see What Is Resource Analyzer?.
Note: In the tables of drill-down links, terms shown in italic represent a placeholder, indicating the term can have different values, depending on the selections for that report.
Benchmarking is a process by which you determine whether your site's service level agreements (SLAs) are being met. Use the Procedure Benchmarks reports to identify response times for requests and other information for analyzing site performance.
Right-click the Procedure Benchmarks report on the tree in the navigation pane and select Run from the context menu. The Report Filter for Procedure Benchmarks window opens.
From the Procedure Name drop-down menu, select the name of the procedure for which you wish to examine information and click View Report.
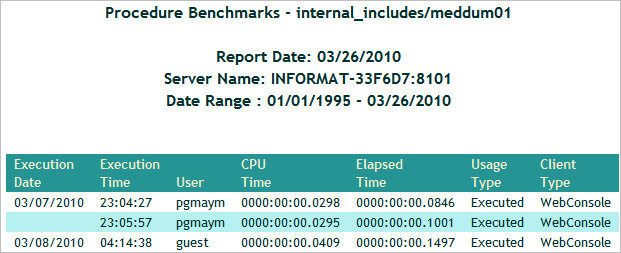
The Monitored Procedure Detail report appears, as shown in the following image. This report shows information about executions of the specified procedure, including execution date and time, user, CPU and elapsed time, usage type and client type. Click any of the hyperlinked column headings to re-sort the report by that column.
Some of the most helpful information Resource Analyzer can provide is about which requests are using the most resources. This kind of information helps you identify causes of network and machine-use bottlenecks and enables you to decide what data needs to be indexed, what requests need to be scheduled, or which users need to be educated. The Excessive Resources reports help you with this investigation.
Right-click Excessive Resources and select Run from the context menu. The Report Filter for Excessive Resources window opens, as shown in the following image.
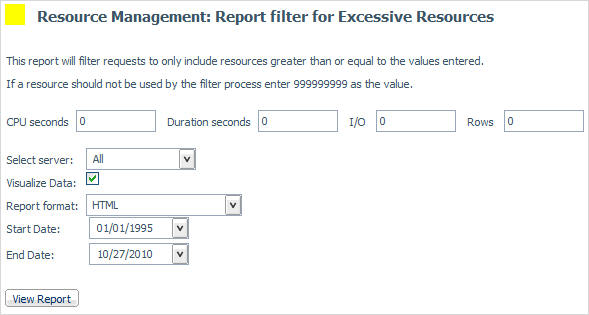
For a request to be included in the report, it need only exceed one of the resource values specified, not all. Specify criteria to limit your report to information on requests that consume resource usage values above a certain average and click View Report.
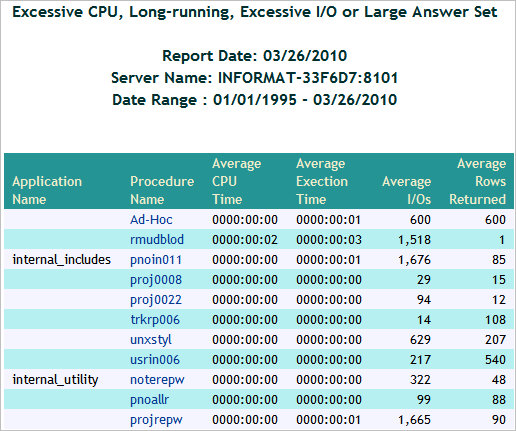
The Excessive Resources report opens, as shown in the following image. This report lists the most resource-intensive procedures, those whose average resource usage values, including CPU seconds, elapsed time, I/Os, and rows returned, exceed at least one of the limits you specified. The report also lists the average resource usage values for each procedure. Click any of the hyperlinked column headings to re-sort the report by that column.
This report has one hyperlink that allows you to drill down to another report, as described in the following table.
|
Drill-Down Hyperlink: Click... |
Report Generated |
Description |
|---|---|---|
|
A value under the Procedure Name column. |
Requests from Procedure Procedure |
Lists the date and time, user, and resource information for each request of the specified procedure. Also allows you to drill down further to see the actual request syntax. |
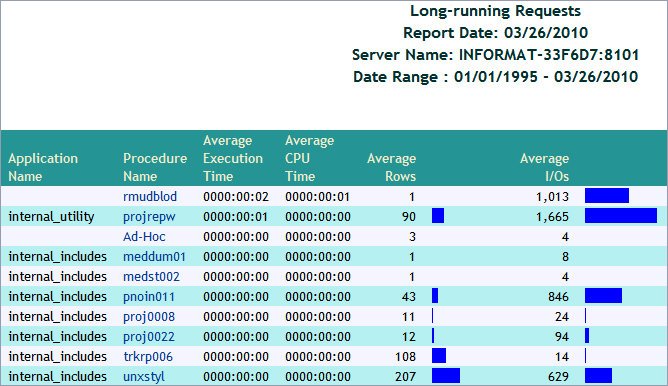
Procedures with long running requests use excessive resources, a particular problem when dealing with operational systems. These procedures should be targeted for optimization.
Right-click Long-running Requests and select Run from the context menu. After specifying report filters, click View Report. The report window opens, as shown in the following image. By default the report is sorted by Average Elapsed Seconds and Average CPU Seconds.
This report has one hyperlink that allows you to drill down to another report, as described in the following table.
|
Drill-Down Hyperlink: Click... |
Report Generated |
Description |
|---|---|---|
|
A value under the Procedure Name column. |
Requests from Procedure: Procedure Name |
Shows the requests that were executed from the selected procedure. Also allows you to drill down further to see the actual request syntax. |
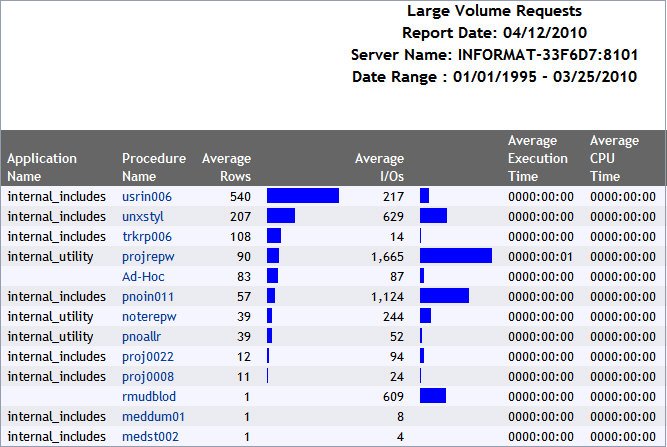
Large volume requests are requests that return more data than might be necessary. These requests can be targeted for optimization. You can identify these reports with the Large Volume Requests Report.
Right-click Large Volume Requests and select Run from the context menu. After specifying report filters, click View Report. The report window opens. By default the report is sorted by Highest Average Rows.
This report has one hyperlink that allows you to drill down to another report, as described in the following table.
|
Drill-Down Hyperlink: Click... |
Report Generated |
Description |
|---|---|---|
|
A value under the Procedure Name column. |
Requests from Procedure Name |
Shows the requests that were executed from the selected procedure. Also allows you to drill down further to see the actual request syntax. |
Dormant data, or data that is very infrequently accessed, can slow response times on your site. Use the Dormant Data reports to identify which data sources and columns have been less recently or never queried and can be deleted or archived to improve performance.
Right-click Dormant Data and select Run from the context menu. After specifying report filters, click View Report. The report window opens.
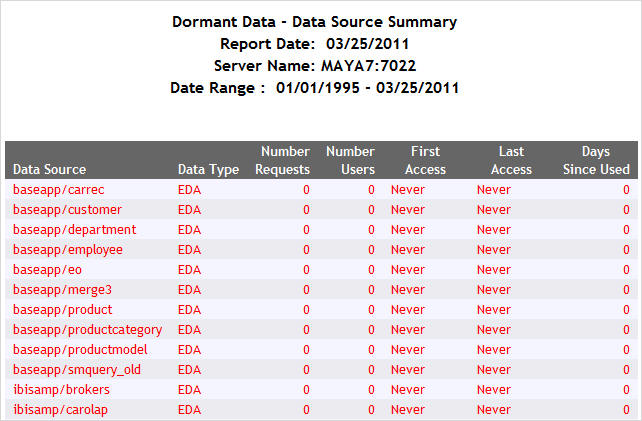
This report shows a variety of information about each data source, such as number of requests, users, resource usage, and access dates. The Days Since Used column indicates the number of days that have passed since the data source was last accessed. By default, the report is sorted by access dates, with those data sources that have no access dates (and are therefore dormant) listed first, and includes all data sources in the application path, including those that aren't being monitored.
This report has one hyperlink that allows you to drill down to another report, as described in the following table.
|
Drill-Down Hyperlink: Click... |
Report Generated |
Description |
|---|---|---|
|
A value under the Data Source column. |
Dormant Data Summary: Column Level for Data Source |
Shows which columns were never accessed in the specified data source, and also lists all accessed columns along with last access time in days. Shows usage for the columns, including whether they were used with functions, relations, selects, sorts, and groups. |
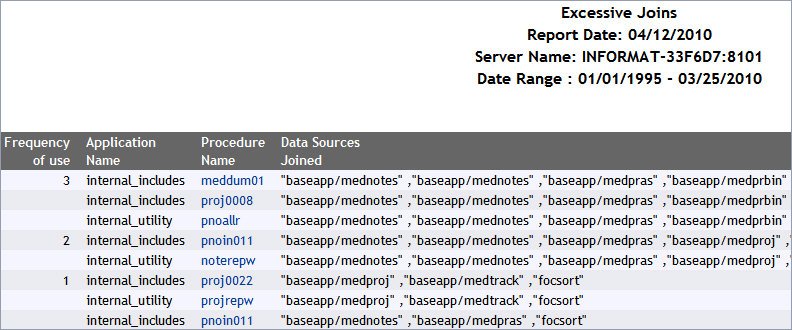
Joining too many tables can be slow and costly. De-normalization can be an effective method for cutting CPU time and improving response times. The Excessive Joins reports help you determine which data is most frequently joined by user requests and helps you decide how to plan your de-normalizing strategies.
Right-click Excessive Joins and select Run from the context menu. After specifying report filters, click View Report. The report window opens. This report lists the most frequently joined data sources along with the procedures used to join them.
This report has one hyperlink that allows you to drill down to another report, as described in the following table.
|
Drill-Down Hyperlink: Click... |
Report Generated |
Description |
|---|---|---|
|
A value under the Procedure Name column. |
Requests from Procedure Joining Data source1, Data source2, Data sourcen |
Shows a variety of information, including date and time, user, CPU seconds, elapsed time, I/Os, and rows returned, about the requests making the specified join. Also allows you to drill down further to see the actual request syntax. |
Efficiencies can be created by calculating column values once and storing the results in summary tables for repeated use. This saves the cost of calculating these values every time a report is run.
Right-click Repeated Aggregations and select Run from the context menu. After specifying report filters, click View Report. The Candidates for Summary Level Databases report opens. This report shows how many requests used different functions on certain columns of data sources, along with the dates of access. Click any of the hyperlinked column headings to re-sort the report by that column.
This report has one hyperlink that allows you to drill down to another report, as described in the following table.
|
Drill-Down Hyperlink: Click... |
Report Generated |
Description |
|---|---|---|
|
A value under the Function column. |
Procedure Summary - Frequency of Use Using Function on Data Source.Column Name |
Summarizes the procedure types (cataloged and ad hoc) that have executed the specified function for the specified data source and column, along with statistics about each execution. Also allows you to drill down further to see a list of the cataloged procedures and information about them. |
Indexing columns that are frequently used in selection criteria for reports can improve efficiency. This report identifies columns that should be indexed.
Right-click Candidates for Column Index and select Run from the context menu. After specifying report filters, click View Report. The report window opens. This report shows how often columns were used as selection criteria in requests. Click any of the hyperlinked column headings to re-sort the report by that column.
| WebFOCUS |