In this section: Reference: |
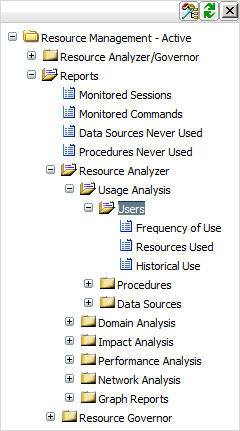
Usage Analysis reports provide information on reporting activity. To access Usage Analysis reports in the Web Console, expand the Usage Analysis folder in the tree and then expand the appropriate Usage Analysis report folder (Users, Procedures, or Data Sources). Right-click the desired type of usage analysis (Frequency of Use, Resources Used, or Historical Use) and select Run from the context menu.
The following image shows the Usage Analysis and Users report folders expanded.

There are three basic Usage Analysis categories:
Usage Analysis Reports can measure three types of usage:
In this section: |
One of the best techniques for improving system performance is to educate users about request preparation. Education involves familiarizing users with what data is available and what constitutes the designs of different data sources. If users understand what is required of them in executing requests, their expectations about system response will be more realistic. After educating users, you can then organize elements of the data according to user needs, taking into account efficient grouping and clustering of this data. Some questions to consider about users are:
The Users reports help you analyze the activity of users at your site and determine such information as: whether users are novice or experienced, which data sources they are accessing most often, when they are using the most resources, and so on.
The following image shows the Users Report by Frequency of Use, which provides a summary of user activity. This report lists users on the left, followed by columns with hyperlinked headings that indicate the number of requests the users submitted, their percentage of total requests and resource usage, and their first and last access dates. Click any of the hyperlinked column headings to re-sort the report by that column.
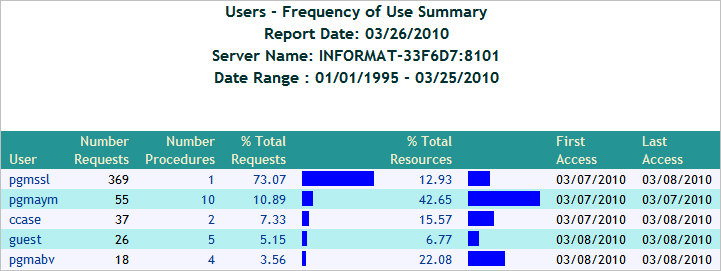
This report has several hyperlinks that allow you to drill down to additional reports. The following table lists and describes these hyperlinks.
|
Drill-Down Hyperlink: Click... |
Report Generated |
Description |
|---|---|---|
|
A value under the User column. |
Data Source Use by User |
Lists the data sources accessed by the specified user, information about the requests, and dates of access. Also allows you to drill down to see column and data type information, as well as procedures used in requests by the specified user. |
|
A value under the Number Procedures column. |
Procedure Summary for User Frequency of Use |
Lists the procedures executed by the specified user along with statistics about each execution. |
|
A value under the % Total Requests column. |
Procedure Summary for User |
Lists the procedures used for requests by the specified user, along with request and resource information and dates of access. Also allows you to drill down to see detailed request information for each procedure as well as the actual request syntax. |
|
A value under the % Total Resources column. |
Resources used by User |
Summarizes the resource usage of the specified user, including number of requests, elapsed time, CPU seconds, I/Os, rows returned, and access dates. |
The following image shows the Users Report by Resources Used, which provides information on resource utilization by user. This report lists users along with the number of requests they submitted, total and average elapsed time, CPU seconds, I/Os, and rows, and their first and last access dates. Click any of the hyperlinked column headings to re-sort the report by that column.
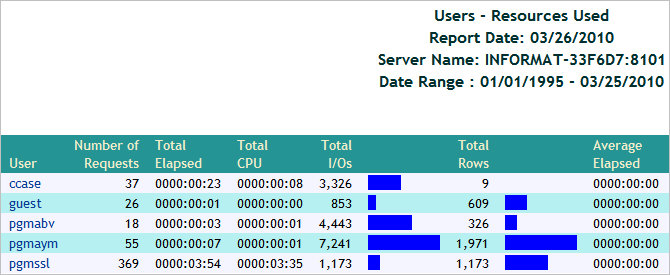
This report has one hyperlink that allows you to drill down to another report, as described in the following table.
|
Drill-Down Hyperlink: Click... |
Report Generated |
Description |
|---|---|---|
|
A value under the User column. |
Data Source Use by User |
Lists the data sources accessed by the specified user, information about the requests, and dates of access. Also allows you to drill down to see column and data type information, as well as procedures used in requests by the specified user. |
The following image shows the Users Report by Historical Use, which provides information on historical activity by user. This report lists users along with the number of requests they submitted in a particular year and the percentages of their requests and resource usage out of the totals of that year. Click any of the hyperlinked column headings to re-sort the report by that column.
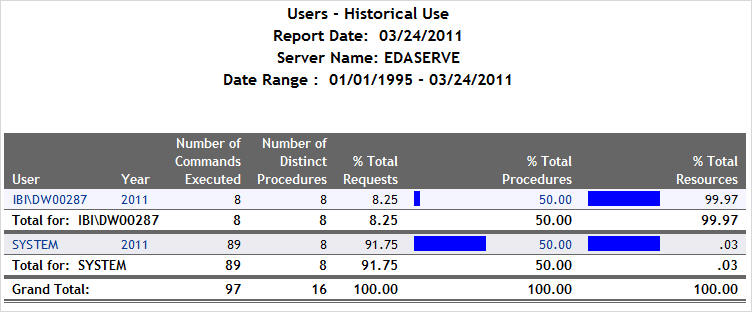
This report has several hyperlinks that allow you to drill down to additional reports, summarized in the following table.
|
Drill-Down Hyperlink: Click... |
Report Generated |
Description |
|---|---|---|
|
A value under the User column. |
Data Source Use by User |
Lists the data sources accessed by the specified user, information about the requests, and dates of access. Also allows you to drill down to see column and data type information, as well as procedures used in requests by the specified user. |
|
A value under the Year column. |
Access per Month for User during Year |
Summarizes by month the number of requests made by the specified user, along with the percentage of the user requests and resource usage out of the particular date totals. |
|
A value under the % Total Resources column. |
Resources used by User |
Summarizes the resource usage of the specified user, including number of requests, elapsed time, CPU seconds, I/Os, rows returned, and access dates. |
In this section: |
The Procedures reports supply a variety of information about the procedures with which users submit requests at your site. This information will help you compare the relative resource usage of cataloged versus ad hoc requests, find out which procedures are the most popular and frequently executed, and thus determine the truly mission-critical applications run at your site.
The following image shows the Procedures Report by Frequency of Use, which provides a summary of procedures being executed. This report lists procedures executed at your site by type, along with statistics about each execution.
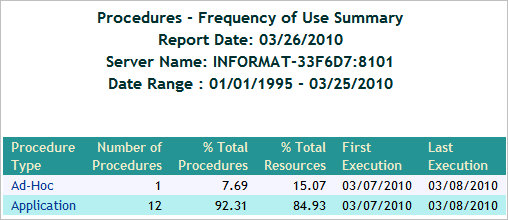
This report has one hyperlink that allows you to drill down to another report, as described in the following table.
|
Drill-Down Hyperlink: Click... |
Report Generated |
Description |
|---|---|---|
|
A value under the Procedure Type column. |
Request from Procedure Ad hoc or Procedure Summary (depending on procedure type selected) |
Lists the date and time, as user, resource, and execution information for all procedures of the specified type. Also allows you to drill down further to see the actual request syntax. |
The following image shows the Procedures Report by Resources Used, which provides a summary of resource utilization by procedure. This report summarizes the resource usage for the procedures executed at your site, including their percentage of total procedures and resources used, as well as total CPU seconds, elapsed time, I/Os, rows, and first and last execution.
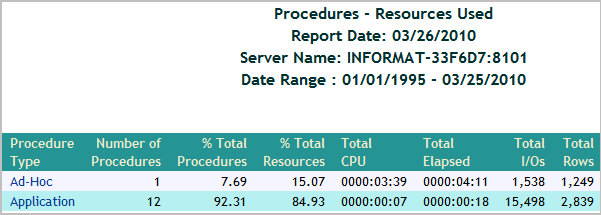
This report has one hyperlink that allows you to drill down to another report, as described in the following table.
|
Drill-Down Hyperlink: Click... |
Report Generated |
Description |
|---|---|---|
|
A value under the Procedure Type column. |
Procedure Resource Utilization |
Summarizes the executions, users, total and average resource usage, and execution dates for procedures of all types. Also lets you drill down on procedure names to see more detailed usage information as well as the actual request syntax. |
The following image shows the Procedures Report by Historical Use, which provides information on historical activity by procedures. This report summarizes by year the number of executions, users, and percentage of executions and resources used by the types of procedures at your site. Click any of the hyperlinked column headings to re-sort the report by that column.
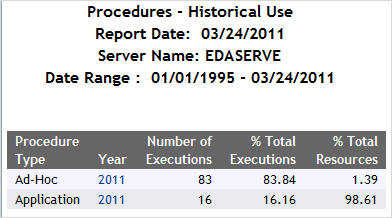
This report has two hyperlinks that allow you to drill down to another report, described in the following table.
|
Drill-Down Hyperlink: Click... |
Report Generated |
Description |
|---|---|---|
|
A value under the Year column. |
Procedure Access by Year by Month |
Lists the year and month for all executed procedures of the specified procedure type. Also lists their number and percentage of executions, their number of users, and their resource usage percentage. |
In this section: |
In order to improve system performance at your site, it is helpful to determine which data sources are most "mission-critical," most popular among your users, and most resource-intensive. The Data Sources reports show you how your data sources are being accessed, as well as, illustrate various activity patterns at your site and the earliest and latest dates that data was accessed.
The following image shows the Data Sources Report by Frequency of Use, which provides a summary of data sources being used. This report lists all accessed data sources along with the number and percentage of requests to each data source, the number of users, the percentage of resources consumed, and access dates. Click any of the hyperlinked column headings to re-sort the report by that column.
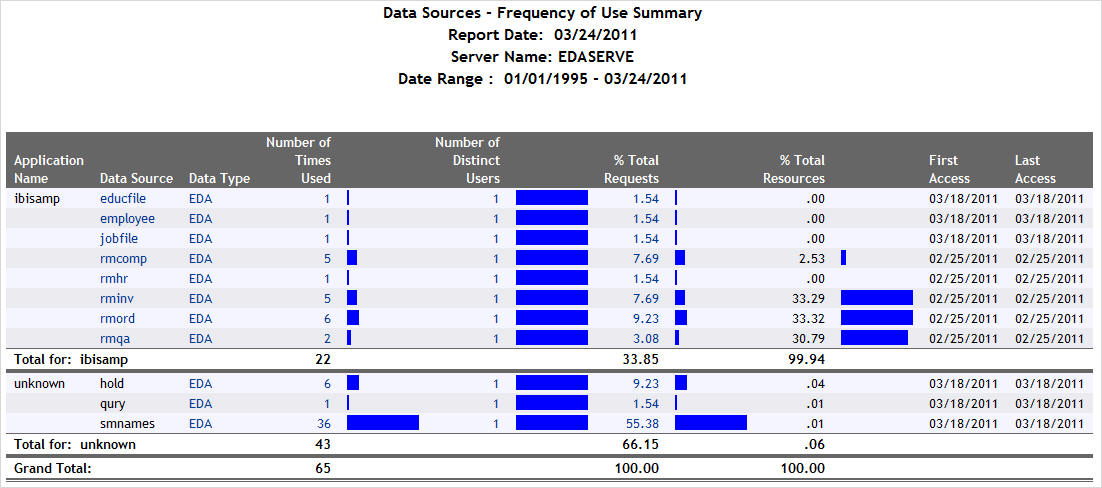
This report has several hyperlinks that allow you to drill down to additional reports, summarized in the following table.
|
Drill-Down Hyperlink: Click... |
Report Generated |
Description |
|---|---|---|
|
A value under the Data Source column. |
Column Level for Data Source Data Source |
Shows usage for the columns for the specified data source, including whether they were used with functions, relations, selects, sorts, and groups, and how many days the column has been unused. Also allows you to drill down to see more information about when the columns were used. |
|
A value under the Data Type column. |
Data Sources of type Data Type |
Lists all the data sources of the specified data type (the engine used in your enterprise) along with the dates of first and last access for each data source. |
|
A value under the Number Requests column. |
Request Activity for Data Source: Data Source |
Shows request activity for all users of the specified data source, including I/Os, rows returned, and elapsed time. Also allows you to drill down further to see the actual request syntax. |
|
A value under the Number Distinct Users column. |
Users of Data Source |
Lists all users of the specified data source along with a summary of the resources they have used. |
|
A value under the % Total Requests column. |
Procedures Using Data Source |
Lists the procedures used to access the specified data source, along with their resource usage and dates of access. Also allows you to drill down on a procedure name to see request information for that procedure and the actual request syntax. |
|
A value under the % Total Resources column. |
Resources Used by Data Source |
Lists the resources used by the specified data source, sorted by date. Also allows you to drill down on the dates to see more detailed data access information by month. |
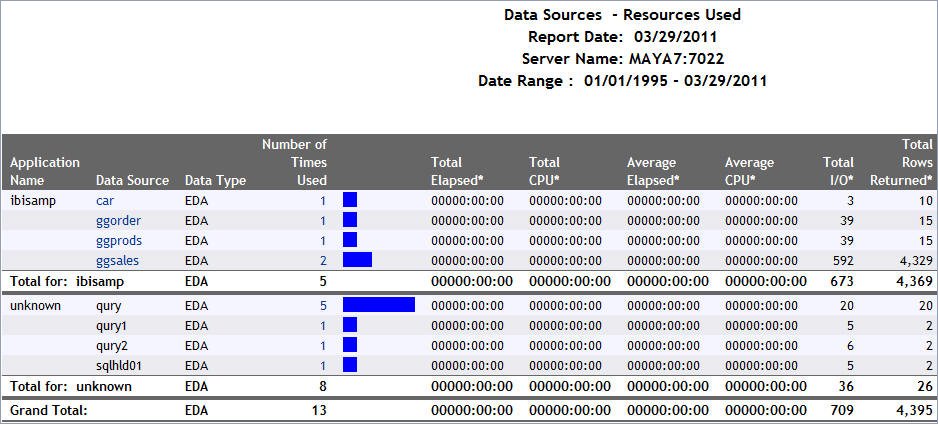
Understanding the patterns of resource usage at your site, including CPU and elapsed time, I/Os, and rows returned, can be helpful in several ways. This kind of information can help you determine which data sources might be good candidates for pre-joining, pre-aggregation, or denormalization, and decide which data to index. In addition, you can monitor users and inform them of their resource usage to encourage them to plan their requests more efficiently. Accessing the Data Sources report category by the Resource Utilization mode of analysis can help you with all of these issues.
The following image shows the Data Sources Report by Resources Used, which provides a summary of resource utilization by data source. This report summarizes the resources used by all data sources at your site, including both total and average elapsed time, CPU seconds, I/Os, and returned rows. Click any of the hyperlinked column headings to re-sort the report by that column.
This report has several hyperlinks that allow you to drill down to additional reports, summarized in the following table.
|
Drill-Down Hyperlink: Click... |
Report Generated |
Description |
|---|---|---|
|
A value under the Data Source column. |
Column Level for Data Source Data Source |
Shows usage for the columns for the specified data source, including whether they were used with functions, relations, selects, sorts, and groups, and how many days the column has been unused. Also allows you to drill down to see more information about when the columns were used. |
|
A value under the Number of Requests column. |
Procedures Using Data Source |
Lists the procedures used to access the specified data source, along with their resource usage and dates of access. Also allows you to drill down on a procedure name to see request information for that procedure and the actual request syntax. |
The accessibility of a Web environment makes rapid growth of your user base inevitable. As more users are accessing more data, monitoring site activity becomes more important, offering you information about the following areas:
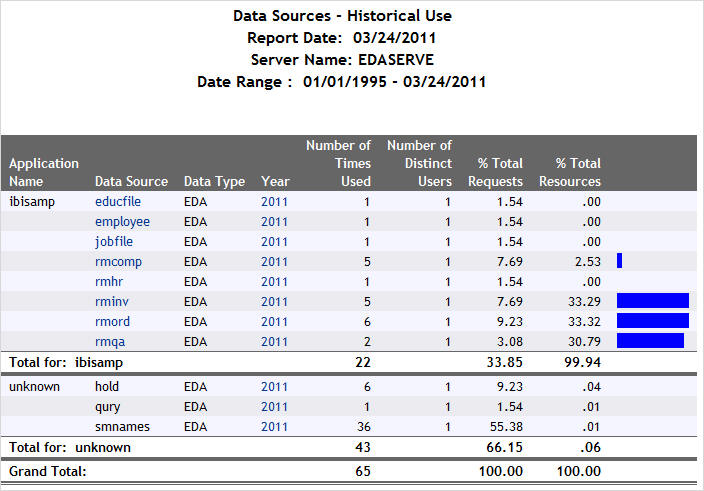
Accessing the Data Sources report category by historical analysis lets you analyze user activity to determine the peaks and valleys in system usage, supplying you with a solid basis for deciding how to schedule requests, educate users, and so on.
The following image shows the Data Sources Report by Historical Use, which provides information on historical activity by data source. This report summarizes request activity by year and month for all accessed data sources at your site. Click any of the hyperlinked column headings to re-sort the report by that column.
This report has several hyperlinks that allow you to drill down to additional reports, summarized in the following table.
|
Drill-Down Hyperlink: Click... |
Report Generated |
Description |
|---|---|---|
|
A value under the Data Source column. |
Column Level for Data Source Data Source |
Shows usage for the columns for the specified data source, including whether they were used with functions, relations, selects, sorts, and groups, and how many days the column has been unused. Also allows you to drill down to see more information about when the columns were used. |
|
A value under the Year column. |
Data Access for Data Source during Year |
Shows data access information for the specified data source and year, including number of requests, elapsed time, CPU seconds, I/Os, and rows returned. Also allows you to drill down on a specific date (month, day, and year) to see request information for that date as well as the actual request syntax. |
| WebFOCUS |