To enable Resource Management, you must have a valid license key. After typing the key, you can specify the type of repository to be used for Usage Monitoring. The Usage Monitoring tables are then created. This procedure shows how to create Usage Monitoring tables in a FOCUS or relational repository using a license code for Resource Analyzer.
Before performing the following steps, make sure the server is running.
-
On a Windows
system, from the Programs Menu, select iWay Software (or Information Builders,
if you have a WebFOCUS server installation), then the server type, and
click Web Console.
If you are using an operating system other than Windows, enter
http://ipaddress:port
where:
- ipaddress
Identifies the server where Resource Analyzer is to be configured.
- port
Is the port number for that server.
Note: On the Program Menu under iWay Software, the server types can include iWay Full-Function Server, or iWay DataMigrator Server. On the Program Menu under Information Builders, the server type can include a WebFOCUS Server. Resource Analyzer can be configured on any of these servers.
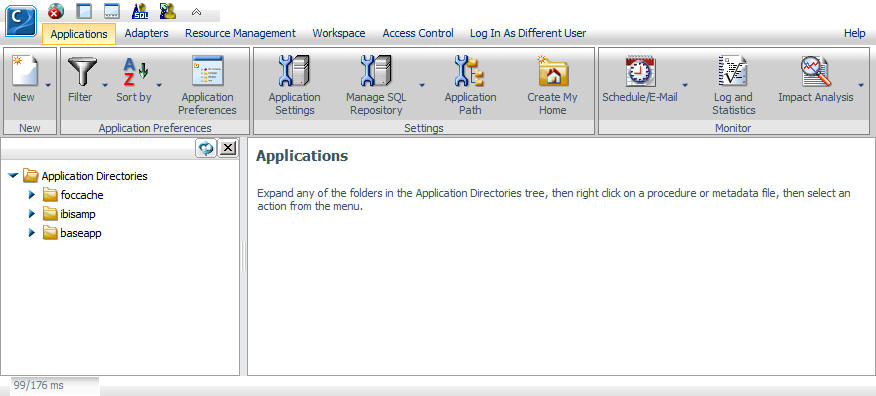
The Web Console opens, as shown in the following image.
-
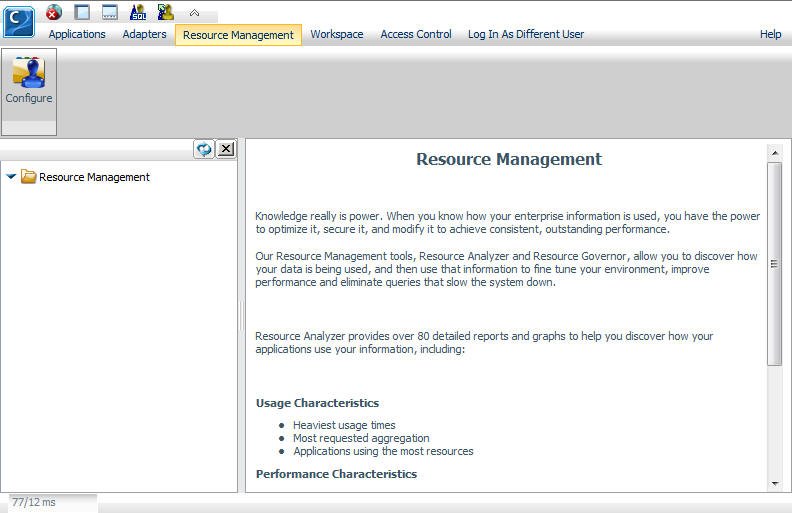
Click the Resource
Management link on the toolbar.
The Resource Management page opens, as shown in the following image.
- Click Configure in the ribbon or right-click Resource Management in the navigation pane and select Configure.
- Type the license key from the packing slip. There are different keys, one for Resource Analyzer, one for Resource Governor, and one if both products are licensed.
-
Click Next.
The Resource Management Configuration pane opens.
-
For a FOCUS Repository:
- Type a Server Name. Used by Resource Analyzer as the server name in collected data and on reports. Any identifier of up to 48 characters is acceptable but the value should be unique across all servers where Resource Analyzer are installed. Host server (computer) name, along with the port used by the server, is the default. It is recommended that this value is not changed.
- Select FOCUS from the Repository drop-down menu.
- Click Next and go to step 8.
-
For a Relational Repository:
- Type a Server Name. Used by Resource Analyzer as the server name in collected data and on reports. Any identifier up to 48 characters is acceptable, but the value should be unique across all servers where Resource Analyzer are installed. Host server (computer) name, along with the port used by the server, is the default. It is recommended that this value is not changed.
-
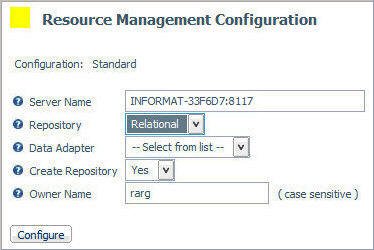
Select Relational from the
Repository drop-down menu. The following image shows the additional
fields that become available.
-
Select an adapter from the Data Adapter drop-down
menu. This adapter identifies the data adapter and the connection
name to be used for storing Resource Analyzer Usage Monitoring data.
The connection name is the logical name used to identify a particular
set of connection attributes. This setting also determines the SUFFIX
used when creating the Master Files for these tables.
Note: If no certified Resource Management adapter has been configured, the only option in the drop-down menu will be FOCUS.
The current list of certified relational engines is:
- DB2
- Oracle
- Informix
- Sybase
- Teradata
- Ingres
- MS SQL Server
- RDB
- MySQL
- PostgreSQL
- Generic ODBC/JDBC for Sybase SQL Anywhere Release 12 only.
Note: The Sybase ASA database used for the Resource Management Repository must be created with the Ignore trailing blanks in string comparisons option (or the -b option in the dbinit command).
-
Set Create Repository to Yes,
unless the repository has already been created using the native
Data Definition Language (DDL) of the Data Adapter or you are configuring
a Many-to-one environment.
When No is selected, the configuration process will not issue DROP TABLE, DROP INDEX, CREATE FILE, and CREATE INDEX commands. Because the configuration process will always initialize the repository with default data and issue the default GRANTS, the repository must exist when the commands are executed or the configuration will fail. Yes is the default value.
For more information, see Using DDL Statements to Create the Internal Tables. For more information on Many-to-one, see Configuring Many-to-One Monitoring.
-
Provide an Owner/Schema. By
default, the tables are created for the specified owner/schema in
the default database, and the owner/schema must be authorized to
create tables in the database.
If the tables are to be created in an alternate database that the owner has rights to, and the technique is supported by the RDBMS, the database name must be specified as well (for example, database.owner). Consult the appropriate RDBMS documentation for the appropriate syntax. On the System I platform, the Owner Name will be shown as Library.
- For servers running on z/OS, HFS, or PDS deployment where DB2 has been selected as the data adapter, provide a DB2 DBSPACE.
- Click Next.
-
The Resource Management Configuration - Initial Properties
pane opens, as shown in the following image.
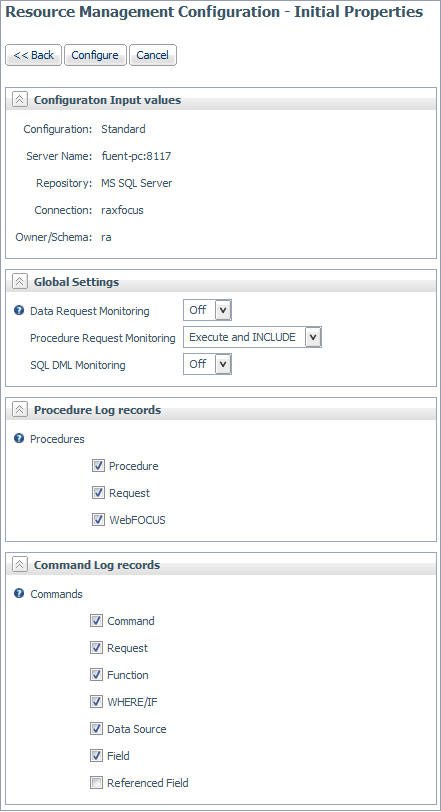
The Resource Management Configuration pane has the following options:
- Configuration Input Values
-
- Configuration
-
The type of Resource Management that is being configured. Depending on your license key, this will show either Standard or Enterprise.
- Server Name
-
The name of the server configured with Resource Management.
- Repository
-
The repository that is being used.
- Connection
-
The data adapter connection of the current configuration. This is only seen with a Relational repository.
- Owner/schema
-
The owner/schema name for the relational adapter that Resource Analyzer will use to create the repository tables. This is only seen with a Relational repository.
Note: For MySQL, this is the database name from the URL specified on the MySQL adapter configuration page.
- Global Settings
-
- Data Request Monitoring
-
Indicates whether Data Request Monitoring is on or off. When Global Data Request Monitoring is enabled, or set to On, Resource Analyzer collects information on all SQL SELECT and FOCUS TABLE, TABLEF, MATCH, GRAPH, MODIFY, and MAINTAIN requests. The default value is Off. Monitoring will be by individually selected data sources.
- Procedure Request Monitoring
-
Indicates the level of Procedure Request Monitoring. The following options are available:
- Execute and Include. All executed procedures and any procedure that used -INCLUDE will be monitored. This is the default value.
- Execute Only. Any procedure that is executed using EX or EXEC will be monitored.
- Primary Execute Only. The only procedure monitored will be the primary procedure. Any procedure executed from within the primary (-INCLUDE or EX) will not be monitored.
- SQL DML Monitoring
-
Indicates whether SQL Data Manipulation Language (DML) is enabled or disabled when monitoring is active. When SQL DML Monitoring is enabled or set to On, Resource Management will monitor SQL INSERT, UPDATE, DELETE, CREATE, ALTER, and DROP requests in addition to the standard data request commands. The default value is Off. This setting should be used to replace the use of SET SMARTMODE = DML, which is now a depreciated setting.
- Procedure Log Records
-
These settings allow for the customization of procedure data to be collected. The following options are available:
- Procedure. Information on the date and time a procedure started, the elapsed time used, the CPU time used, and wait time, as well as other detailed information about the request.
- Request. The actual command as executed.
- WebFOCUS. WebFOCUS specific data, such as the MR Domain, the BASEDIR value, and the APP Path used.
- Command Log Records
-
These settings allow for the customization of command data to be collected. The following options are available:
- Command. Information on the date and time a command started, the elapsed time used, the CPU time used, and wait time, as well as other detailed information about the request.
- Request. The actual command as executed. For example, TABLE FILE CAR PRINT CAR END.
- Function. Data about aggregate functions used on fields.
- WHERE/IF. Data on the Relational tests used in a request, such as the operator used, literals used, or date and time values used.
- Data Source. The Master File Description/Synonym name or RDBMS table or tables used in a request.
- Field. The field(s) used, the type of field and whether it was used in a sort or group in a request.
- Referenced Field. Information about any DEFINE fields used or referenced in a request.
The following table shows the comparisons between the Monitoring settings in 7.6, and earlier releases, and the Command Log records settings in Release 7.7.
Release 7.6
Release 7.7
Monitoring Settings
Command Log Records
All Data
Select all
Query, Froms, Relations, and Columns
Commands, Request, Data Sources, WHERE/IF, and Fields
Query, Froms, and Relations
Commands, Request, Data Sources, and WHERE/IF
Query and Froms
Commands, Request, and Data Sources
Query only
Commands and Requests
Note: The All Data option in Release 7.6 also collects SORT and Functions. In Release 7.7, SORT has been included in Fields, and Functions has its own select box.
The commands option in Release 7.7 will also collect information about Remote requests from a HUB-SUB configuration.
Resource Management will always collect session records and this feature cannot be turned off.
By default, command records (for example, a TABLE command being issued) will also be collected for a data resource that is not being monitored.
-
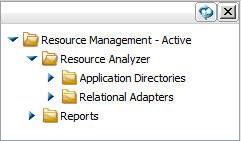
Click Configure.
The Resource Management: Resource Analyzer page opens, and the navigation pane on the left appears, as shown in the following image.