These reports provide overviews of the data sources
and procedures being monitored, as well as those procedures in the
server application path that have never been executed. General Reports
appear only on the Web Console. They are not available from the Resource
Management Console for MVS users.
x
The Monitored Sessions report provides an overview of
the procedures and commands that are being monitored, including
the number of records processed, and the rows returned.
To access the Monitored Sessions report in the Web Console, click
Resource Management on the toolbar and expand the Reports folder.
Right-click Monitored Sessions, and select Run from the
context menu. After specifying report filters, click View
Report.
The following image shows the Monitored Sessions report.
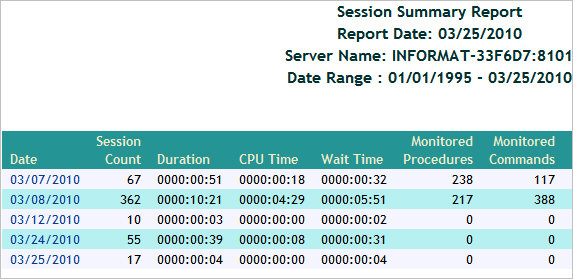
This report has one hyperlink that allows you to drill down to
another report, as described in the following table.
|
Drill-Down Hyperlink: Click...
|
Report Generated
|
Description
|
|---|
|
Date
|
Session Summary Report by Hour
| |
x
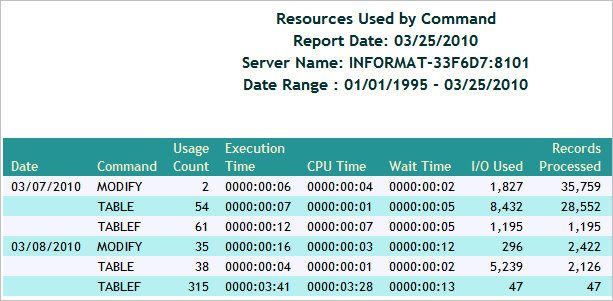
The Monitored Commands report provides an overview of
the resources being used by each command, including the execution,
CPU, and wait time.
To access the Monitored Commands report in the Web Console, click
Resource Management on the toolbar and expand the Reports folder.
Right-click Monitored Commands, and select Run from
the context menu. After specifying report filters, click View Report.
The following image shows the Monitored Commands report.
x
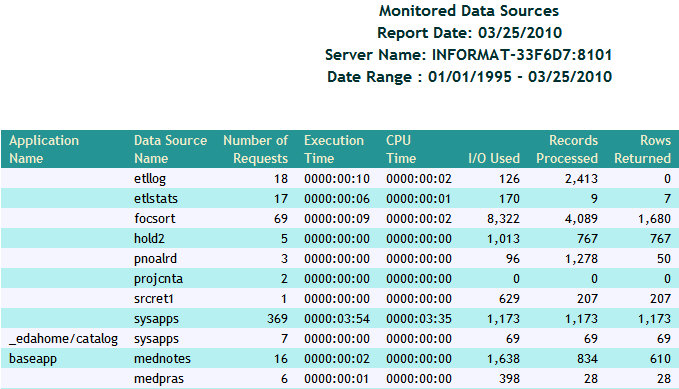
The Monitored Data Sources report provides an overview
of the data sources that are being monitored, including number of
requests, and the first and last access dates.
To access the Monitored Data Sources report in the Web Console,
click Resource Management on the toolbar and expand the Reports
folder. Right-click Monitored Data Sources,
and select Run from the context menu. After
specifying report filters, click View Report.
The following image shows the Monitored Data Sources report.
x
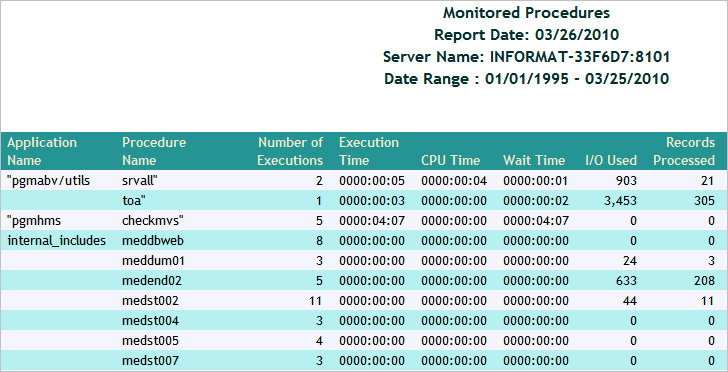
The Monitored Procedures report provides an overview
of the procedures that are being monitored, including the number
of executions, and the first and last execution dates.
To access the Monitored Procedures report in the Web Console,
click Resource Management on the toolbar and expand the Reports
folder. Right-click Monitored Procedures,
and select Run from the context menu. After
specifying report filters, click View Report.
The following image shows the Monitored Procedures report.
x
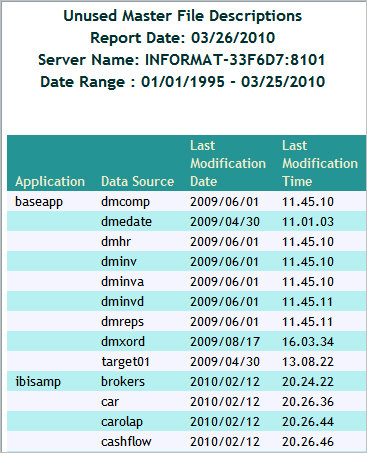
The Data Sources Never Used report provides an overview
of unused data sources, including the application directory they
are found in, and the last modification date and time.
To access the Data Sources Never Used report in the Web Console,
click Resource Management on the toolbar and expand the Reports
folder. Right-click Data Sources Never Used,
and select Run from the context menu. After
specifying report filters, click View Report.
The following image shows the Data Sources Never Used report.
x
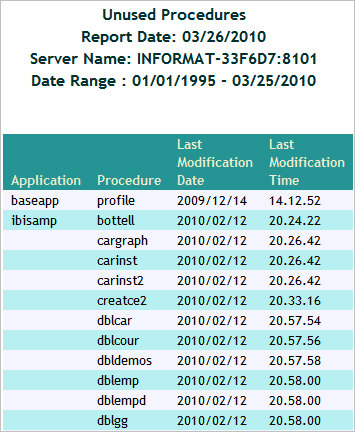
The Procedures Never Used report lists those procedures
in the server's application path that have never been executed.
To access the Procedures Never Used report in the Web Console,
click Resource Management on the toolbar and expand the Reports
folder. Right-click Procedures Never Used,
and select Run from the context menu. After
specifying report filters, click View Report.
The following image shows the Procedures Never Used report.