In this section: |
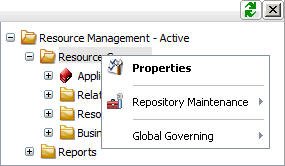
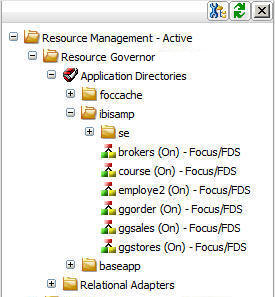
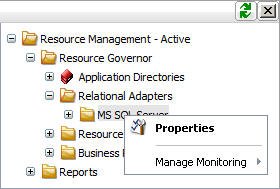
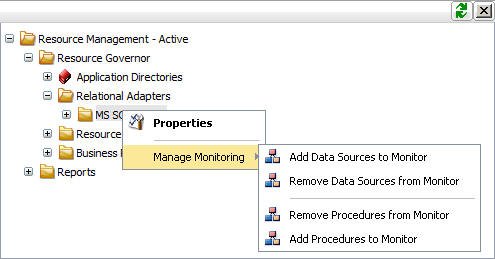
When you right-click the Resource Management - Active node, a context menu is available, as shown in the following image.
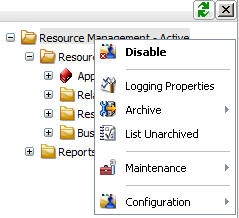
The following sections provide detailed explanations for each option in this context menu.
When you enable Resource Management, it automatically turns on monitoring. However, you can disable and re-enable monitoring at any time.
The reporting server will write all information regarding monitored sources to a log file. This log file is then archived to the Resource Management repository at predetermined intervals or limits, while the server is running. The current log is also archived when the server starts or when the administrator submits a job from the Web Console of a running server.
The intervals or limits can be configured from the Logging Properties option in the Resource Management Web Console. When configured, the log file of an active server will be archived based on the maximum number of sessions and/or the days set or based on a scheduled job configured by the administrator.
Note: Logging properties can also be set under the Workspace, Logs and Traces, Resource Management Logs option from the Web Console main menu bar.
Logging properties can be configured in the Resource Management Web Console. When configured, the log files will be archived based on the maximum number of sessions and days set or based on a scheduled job configured by the administrator.
- Launch the Web Console.
- Click the Resource Management option on the toolbar.
-
Right-click Resource Management - Active/Inactive in
the navigation pane and then select Logging Properties.
The Resource Management Logging Properties window opens, as shown in the following image.
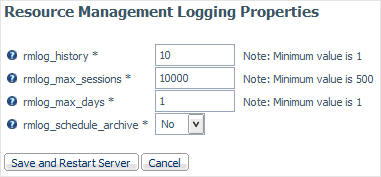
The following options are available:
- rmlog_history
-
The number of archived files kept. The default value is 10.
- rmlog_max_sessions
-
The number of sessions recorded in the active log file before the log is archived and a new log is started. The default value is 10000.
- rmlog_max_days
-
The number of days an active log file is kept open before it is archived and a new log is started. The default value is 1.
- rmlog_schedule_archive
-
When set to No, automatic archiving is active and based on the two settings above.
When set to Yes, only the rmlog_history_entry is shown and the administrator has to configure the schedule archive settings. Selecting Yes will cause a restart of the server and you will need to schedule the archive job.
After the server restarts, the web console will refresh. Click the Resource Management option on the toolbar. Right-click Resource Management - Active/Inactive in the navigation pane and select Logs.
Select Schedule Save log job. The Manage Schedule pane opens. Select the Schedule the procedure check box to see additional options. The recommended schedule settings are as follows:
- Schedule Type - Recurring
- Interval Type - Weekly
- In the Start and Stop fields, select the date which then will set the reoccurring day of the week. Select the time at which the job will start. Do not select Specify End Date.
- Leave the Special data/time ranges section blank.
- If the e-mail notification has been configured on this server, complete the E-mail Notification section, if required.
- Make your desired changes and click Save and Restart Server.
When this option is selected, a context menu is shown with the following options:
- Submit archived job
- View archive jobs
These give the administrator the option to archive the current log file (a new log file is automatically started), as well as view previous archive jobs including any that were submitted due to server restart, and any of the intervals or limits mentioned above having been reached.
- Launch the Web Console.
- Click the Resource Management option on the toolbar.
-
Right-click Resource Management - Active/Inactive in
the navigation pane, select Archive and then
select Submit Archive job.
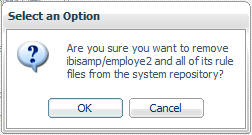
The Select an Option dialog box opens, as shown in the following image.
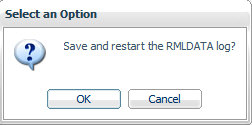
- Click OK to save the log data.
- Launch the Web Console.
- Click the Resource Management option on the toolbar.
-
Right-click Resource Management - Active/Inactive in
the navigation pane, select Archive and then
select View Archive jobs.
The Deferred List opens showing the saved logs, as shown in the following image.
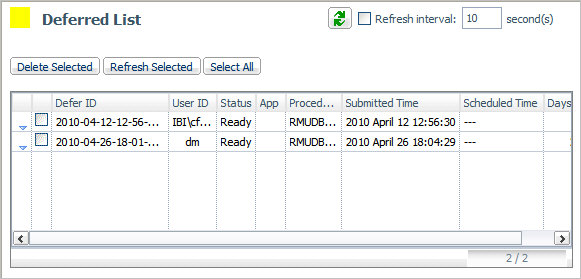
- Right-clicking an item in the Defer ID column provides more options. Select Get to see the output, or Delete to delete the selection.
Select this option to show a list, if any, of previous log files that have not been archived.
- Launch the Web Console.
- Click the Resource Management option on the toolbar.
-
Right-click Resource Management - Active/Inactive in
the navigation pane and select List Unarchived.
The Resource Management Unarchived logs list opens listing the non archived logs, as shown in the following image.
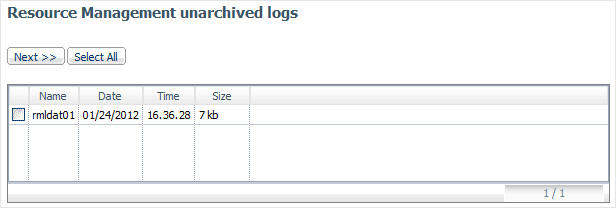
- Select an unarchived log and click Next to archive the desired unarchived logs.
- Select a date and time to archive and click Continue.
Repository data can be deleted once it has been used or reported on. This deletion can be by date range or, if sufficient data has been stored, the data can be deleted if it is more than one, three, or six months old.
- Launch the Web Console.
- Click the Resource Management option on the toolbar.
-
Right-click Resource Management,
select Maintenance, and select Submit
Maintenance job.
The Resource Management Repository Maintenance pane opens, as shown in the following image.
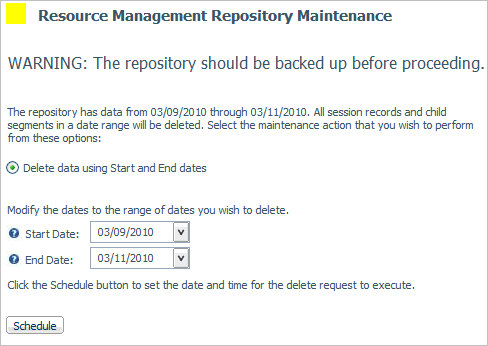
Note: If the range of data is older than one month, the options on the Repository Maintenance pane will be slightly different than shown in the above image.
- Enter a Start Date and End Date for deletion of data through that range, or click the down arrow button on the right of each date input box to choose the dates.
-
Click Schedule.
Note: Caution should be used when using this utility. Make sure you have a backup of the data before you proceed.
The Submit Repository Maintenance Job window opens.
- Enter a date and time for the maintenance job to be executed. Click Submit.
A Deferred Execution pane opens confirming your request.
- Launch the Web Console.
- Click the Resource Management option on the toolbar.
-
Right-click Resource Management,
select Maintenance, and select View
Maintenance jobs.
The Deferred List pane opens, as shown in the following image.
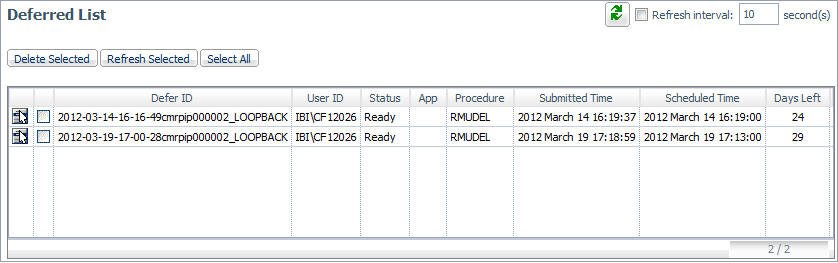
- To delete any of the scheduled maintenance jobs, select the check box next to the job you want to delete, and select Delete Selected.
When this option is selected, a context menu is shown with the following options:
- Properties
- Configure Application Path
- Migrate prior release data
- View Migration jobs
- Change License Key
- Remove
These give the administrator the option to see current configuration settings, as well as change the viewable application directories, perform migration, change a license key, and remove the current Resource Management configuration.
Setting monitor properties enables you to select global settings and the component levels to be monitored. Components are split into two categories, Procedure and Command. The information that Resource Governor monitors is stored in the Usage Monitoring tables. The default settings are: Global Data request Monitoring set to off and component level set to Command. Session records are always captured.
To set Resource Management Properties:
- Launch the Web Console.
- Click the Resource Management option on the toolbar.
- Right-click Resource Management - Active/Inactive in the navigation pane, select Configuration and select Properties.
-
Choose the type of data to be collected from the options
listed under Procedure Log Records and Command Log Records.
The Resource Governor Properties page opens, as shown in the following image.
Note: By default, all options are selected.
The Resource Governor Properties pane has the following options:
- Configuration Properties
-
- Configuration Date
-
The date that Resource Management was configured or reconfigured.
- Repository Type
-
The repository that is being used.
- Data Adapter Connection
-
The data adapter connection of the current configuration.
- Owner/schema
-
The owner/schema name for the relational adapter that Resource Governor will use to create the repository tables.
- Data Sources Monitored
-
The number of application data sources and relational pass-thru data sources that have been enabled for monitoring. This will show Global monitor enabled if Data Request Monitoring is On. See the Global Settings section below for more information.
- Data Sources Not Monitored
-
The number of application data sources and relational pass-thru data sources that have been disabled by setting the monitoring setting to OFF.
- Excluded Procedure Count
-
The number of procedures that have been excluded from monitoring.
- Last Maintenance Date
-
The date the repository was modified using the Repository Maintenance page.
- Last Repository Update
-
The last time the repository updated to include data from a log file.
- Global Settings
-
- Data Request Monitoring
-
Indicates whether Data Request Monitoring is on or off. When Global Data Request Monitoring is enabled, or set to On, Resource Governor collects information on all SQL SELECT and FOCUS TABLE, TABLEF, MATCH, GRAPH, MODIFY, and MAINTAIN requests. The default value is OFF. Monitoring will be by individually selected data sources.
- Procedure Request Monitoring
-
Indicates the level of Procedure Request Monitoring. The following options are available:
- Execute and Include. All executed procedures and any procedure that included using -INCLUDE will be monitored. This is the default value.
- Execute Only. Any procedure that is execute using EX or EXEC will be monitored.
- Primary Execute Only. The only procedure monitored will be the primary procedure. Any procedure executed from within the primary (-INCLUDE or EX) will not be monitored.
- SQL DML Monitoring
-
Indicates whether SQL Data Manipulation Language (DML) is enabled or disabled when monitoring is active. When SQL DML Monitoring is enabled, or set to On, Resource Management will monitor SQL INSERT, UPDATE, DELETE, CREATE, ALTER, and DROP requests in addition to the standard data request commands. The default value is OFF. This setting should be used to replace the use of SET SMARTMODE = DML, which is now a depreciated setting.
- Procedure Log Records
-
This setting allows for the customization of procedure data to be collected. The following options are available:
- Procedure. Contains information on the date and time a procedure started, the elapsed time used, the CPU time used, and wait time, as well as other detailed information about the request.
- Request. The actual command as executed.
- WebFOCUS. Contains WebFOCUS specific data such as The MR Domain, the BASEDIR value, the APP Path used.
- Command Log Records
-
This setting allows for the customization of command data to be collected. The following options are available:
- Command. Contains information on the date and time a command started, the elapsed time used, the CPU time used, and wait time, as well as other detailed information about the request.
- Request. The actual command as executed. For example, TABLE FILE CAR PRINT CAR END.
- Function. Contains data about aggregate functions used on fields.
- WHERE/IF. Contains data on the Relational tests used in a request, such as the operator used, literals used, or date and time values used.
- Data Source. Contains the MFD or RDBMS table or tables used in a request.
- Field. Contains the field used, the type of field and whether it was used in a sort or group.
The following table shows the comparisons between the Monitoring settings in 7.6, and earlier releases, and the Command Log records settings in release 7.7.
Release 7.6
Release 7.7
Monitoring Settings
Command Log Records
All Data
Select all
Query, Froms, Relations, and Columns
Commands, Request, Data Sources, WHERE/IF, and Fields
Query, Froms, and Relations
Commands, Request, Data Sources, and WHERE/IF
Query and Froms
Commands, Request, and Data Sources
Query only
Commands and Requests
Note: The All Data option in release 7.6 also collects SORT and Functions. In release 7.7, SORT has been included in Fields, and Functions has its own select box.
The commands option in release 7.7 will also collect information about Remote requests from a HUB-SUB configuration and, if active, Resource Governor records.
Resource Management will always collect session records and this feature cannot be turned off.
By default, command records (for example, a TABLE command being issued) will also be collected for a data resource that is not being monitored.
- Click Save.
You can configure the application path to set the viewable directories for Resource Governor.
- Launch the Web Console.
- Click the Resource Management option on the toolbar.
-
Right-click Resource Management - Active/Inactive in
the navigation pane, select Configuration and
then select Configure Application Path.
The Application Path pane opens, as shown in the following image.
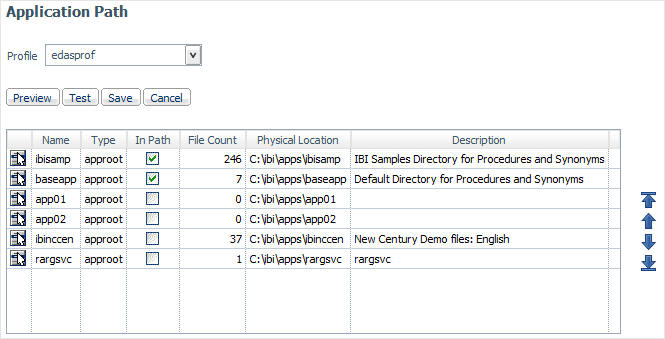
- To add or remove a directory from the application path, select its In Path check box and click Save.
- Refresh the navigation pane to see the newly added or removed directory.
For more information on how to migrate Resource Management, see Migrating the Resource Management Repository.
A license key is required to run Resource Governor. You can change the license key you are using from within Resource Management at any time.
- Launch the Web Console.
- Click the Resource Management option on the toolbar.
-
Right-click Resource Management - Active/Inactive in
the navigation pane, select Configuration and
then select Change License Key.
The Resource Management Configuration pane opens showing your current license, as shown in the following image.
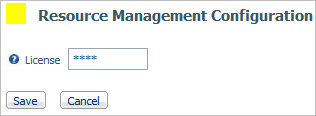
- Enter the new license into the License field and click Save.
You can remove Resource Management from the server from the Resource Management Configuration pane. This is required if you want to change the repository type from FOCUS to relational, or vice versa.
- Launch the Web Console.
- Right-click Resource Management Active/Inactive in the navigation pane.
-
Select Configuration and click Remove from
the context menu.
The Resource Management Confirmation pane opens.
- Click Remove to remove Resource Management from the server. All system files and the Repository will be removed from the server.