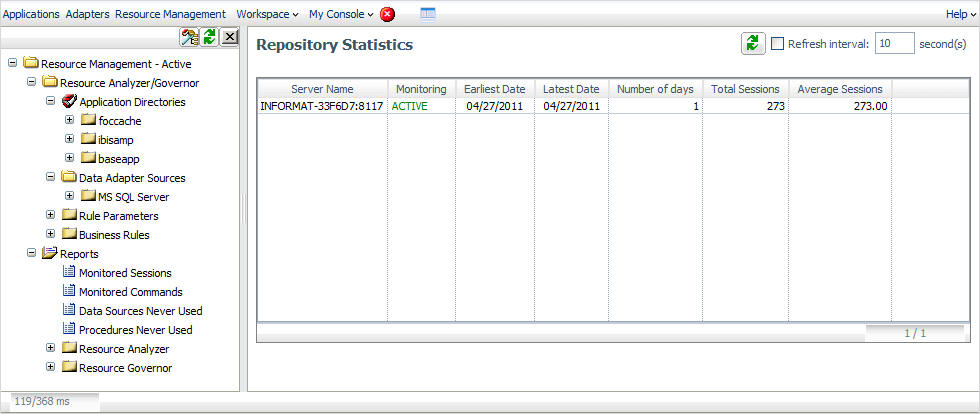
Before Resource Analyzer can monitor request information, it must know your monitoring requirements. You specify these requirements through the Web Console of the server, using the Resource Management Administration Tool. You can specify a range of monitoring configurations depending on your needs. The following image shows sources being monitored from the Web Console of the server.
The monitoring process is as follows:
- A request is issued by a user trying to access data from a data source.
- This request is processed by the server, which calls the Usage Monitor just prior to retrieving the first record for the request.
- The Usage Monitor captures the request attributes and stores them until the request finishes retrieving data.
- The Usage Monitor is called once more to gather resource usage statistics.
- The logged information is stored in the Usage Monitoring tables. For more information about Usage Monitoring, see Administrative Usage Monitoring Tables Column Descriptions.
Over time, you may find that Usage Monitoring data that has accumulated is no longer relevant to your current activity and analysis. When this is the case, Resource Analyzer allows you to delete this data from the Usage Monitoring tables by using the Web Console of the server.
For more information about using the Web Console of the server to set monitoring configurations and delete data, see Configuring and Administering Resource Management From the Web Console.