You can use report data by copying it into an other
application or by exporting it into Microsoft Excel. You can also
manipulate the display of a report and print it.
For information about the Reports toolbar, which becomes active
when you run a report, see Reports Toolbar.
x
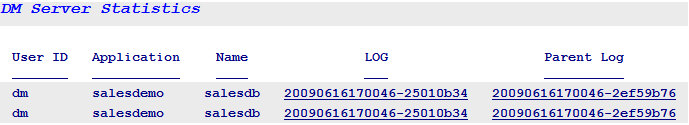
Procedure: How to Copy Report Output to the Clipboard
You can copy all or part of a report
to the clipboard and paste it into a text editor or other application.
After running a report:
-
Select
the part of the report that you want to copy. To copy the entire
report, click the upper left hand cell which selects all rows and
columns.
Note: Select a row by clicking its row number. Select
a column by clicking its title. Use the Shift and Ctrl keys to make
multiple row or column selections.
-
Click
the Copy as Text
 button on the Reports toolbar,
or right-click and select Copy as Text.
button on the Reports toolbar,
or right-click and select Copy as Text.
or
Select Copy from the Edit
menu.
-
In another
application, select Paste from the Edit menu
or use Ctrl+V to copy the selected data.
x
Procedure: How to Export a Report to Microsoft Excel
You
can export all or part of a report to Microsoft Excel.
Note: This
option is only available with the Alpha or Original output format.
After
running a report:
-
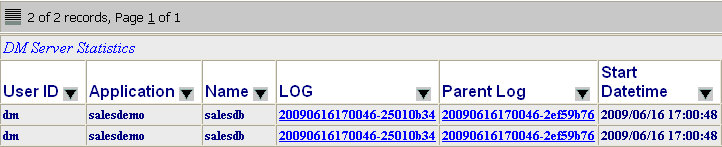
Select
the part of the report that you want to export. If you do not select
a part of the report, the entire report will be exported.
Note: Select a row by clicking its row number. Select
a column by clicking its title. Use the Shift and Ctrl keys to make
multiple row or column selections.
-
Click
the Export to Excel
 button on the Reports toolbar,
or right-click and select Export to Excel.
button on the Reports toolbar,
or right-click and select Export to Excel.
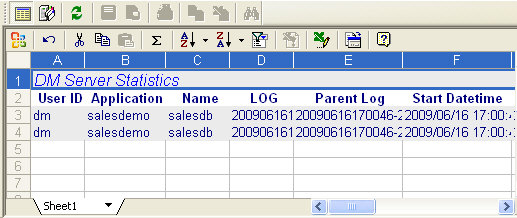
The
report opens in the Microsoft Excel, as shown in the following image.
x
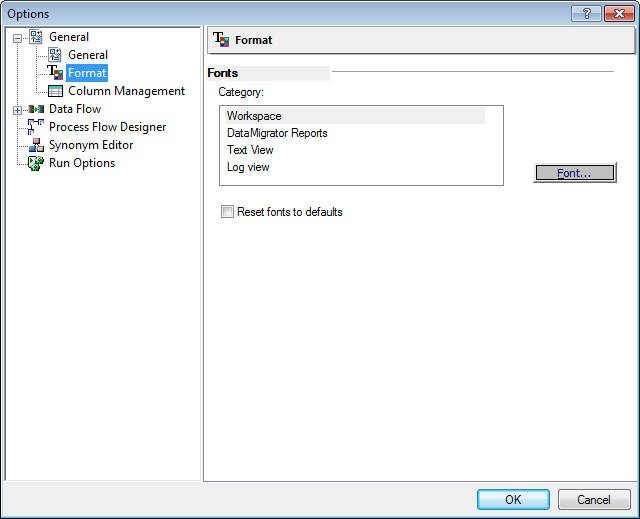
Procedure: How to Change the Report Font
You
can change the font used in reports.
-
Choose Options from
the Tools menu.
The General settings page appears in the right pane.
-
Click
the Format link on the User Preferences tree.
The Format settings page appears in the right pane, as
shown in the following image.
-
Click DataMigrator
Reports in the Fonts text box.
-
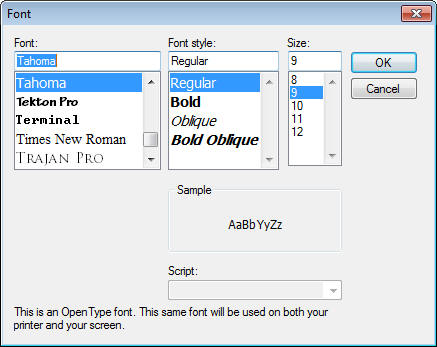
Click
the Font button.
The Font dialog box opens, as shown in the following image.
-
Select
the font attributes, and click OK.
The
changes will be applied the next time you run a report.
x
Procedure: How to Change the Report Format
You
can change the format for reports.
-
Choose Options from the Tools menu.
The General settings page appears in the right pane.
-
Click the Run Options link on the User Preferences
tree.
The Run Options settings page appears in the right pane.
-
From the Test reports default format drop-down menu, select
which format you would like the report to be in.
The format options are the following:
-
HTML
-
HTML - plain text
-
active report
-
Excel
-
PDF
-
Unformatted
For
more information regarding setting preferences for test reports,
see User Preferences - Run Options.
x
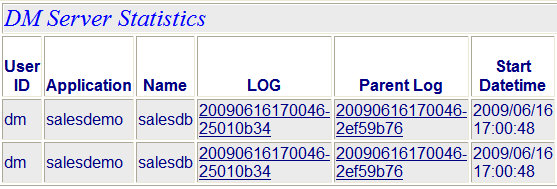
Procedure: How to View the Top Level Procedure
When you schedule or
submit a process flow that calls other flows, it can be useful to see
both the name of the flow that is currently running, and the one
that started the process while viewing the Data Services Agents
report.
To view a top level procedure:
-
From the DMC, with an Application or Server Administrator user
ID, expand the Workspace folder.
-
Right-click Data Services and
select Agents.
-
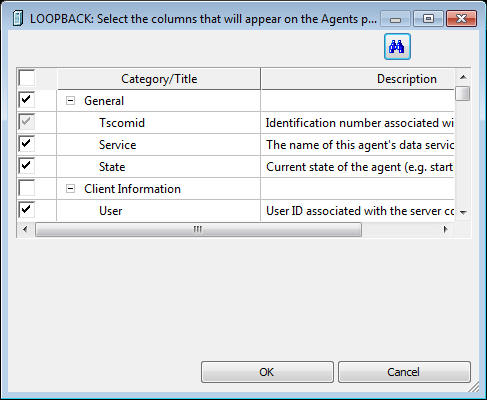
Click the Choose Columns button.
The Select the columns... dialog box opens, as shown in
the following image.
-
Select the Top Level Procedure check
box from the Category/Title column.
-
Click OK.
-
Click the Refresh button.
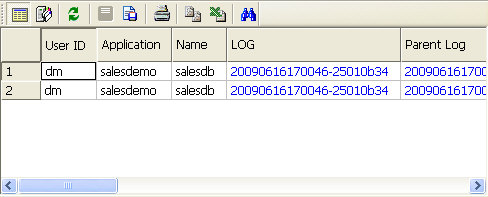
As shown in the following image, the dsloadfact procedure
was called by the Top Level Procedure ibisamp/dsflows.

x
Procedure: How to Print a Report
When viewing a report on
the screen, you can print the report by using any of the following
methods:
- Clicking the Print
 button.
- Selecting Print from the File menu.
- RIght-clicking anywhere in the report and selecting Print from
the context menu.
- Pressing Ctrl + P
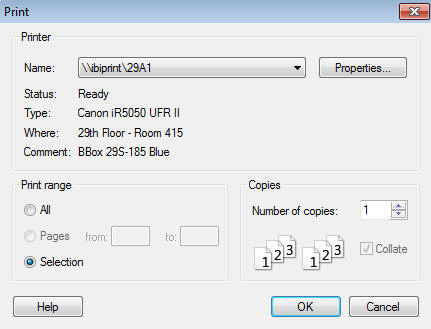
The standard Print dialog box
opens, where you can select a printer destination, number of copies,
and other print properties.
Note: If you selected a
range of cells in the report, you can click the Selection radio
button to only print that range, as shown in the following image.
x
Procedure: How to Print Preview a Report
When
viewing a report on the screen, you can preview the report by using
any of the following methods:
- Clicking the Print
Preview button.
- Selecting Print Preview from the File
menu.
- RIght-clicking anywhere in the report and selecting Print Preview from
the context menu.
- Pressing Ctrl + I
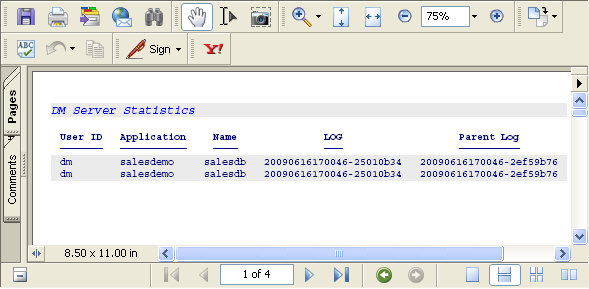
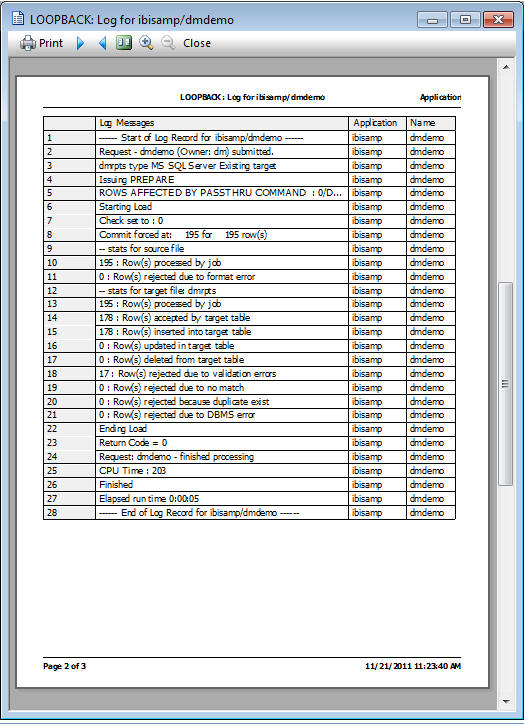
The print preview window opens,
as shown in the following image.
x
Reference: Print Preview Toolbar
The
Print Preview toolbar contains the following buttons:
|
Button
|
Function
|
|---|
|

|
Print
Prints the report.
|
|

|
Next
Shows the next page of the report.
|
|

|
Previous
Shows the previous page of
the report.
|
|

|
Toggle one page/two page display
Switches
the view between one page or two.
|
|

|
Zoom in
Zooms in to the page.
|
|

|
Zoom out
Zooms out of the page.
|
|

|
Close
Closes the print preview.
|
x
Procedure: How to Print a Report for Certain Pages
When
viewing a report on the screen:
-
Select File and then Print from
the main menu.
The Print dialog box opens.
-
Select the Pages radio button
in the Print Range section and enter the page numbers that you want
to print.
-
Click OK.
x
Procedure: How to Print a Report for Selected Rows or Columns
When
viewing a report on the screen in a grid:
-
Select the columns you want to print by clicking
on the title bar. You can also select specific rows and columns
by using CTRL-click or SHIFT-click.
-
Select File and then Print from
the main menu.
The Print dialog box opens.
-
Select the Selection radio button
from the Print Range section.
-
Click OK.