There are a few notable syntactical differences between TABLE and GRAPH. Specifically, the following restrictions apply:
- A GRAPH request must contain a display command with at least one display field and at least one sort phrase (BY or ACROSS) in order to generate a meaningful graph.
- In GRAPH requests the object of the display command must always be a numeric field.
- No more than five display fields are permitted in a GRAPH request. Standard graph formats generally do not permit more variables to be displayed without rendering the graph unreadable.
- Several BY phrases can be used in a request, in which case multiple graphs are created. A single ACROSS phrase is allowed in a GRAPH request, and requests for certain graph forms can contain both ACROSS and BY phrases.
- The number of ACROSS values cannot exceed 64.
- The RUN option is not available as an alternative to END.
The following illustrates how a TABLE request can easily be converted into a GRAPH request by changing the TABLE command to a GRAPH command.
TABLE FILE GGORDER
HEADING CENTER
"SAMPLE TABLE"
SUM QUANTITY
BY PRODUCT_DESC AS 'Coffee Types'
WHERE PRODUCT_DESC EQ 'French Roast' OR 'Hazelnut' OR 'Kona'
END
The output is:
        SAMPLE TABLE
Coffee Types      Ordered Units
------------      -------------
French Roast             285689
Hazelnut                 100427
Kona                      61498
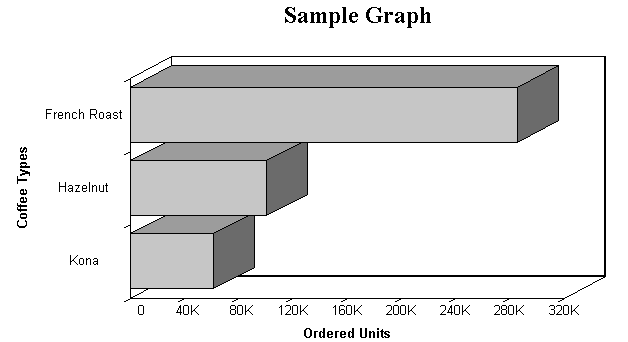
The same request with a GRAPH command in place of the TABLE command is:
GRAPH FILE GGORDER
HEADING CENTER
"Sample Graph"
SUM QUANTITY
BY PRODUCT_DESC AS 'Coffee Types'
WHERE PRODUCT_DESC EQ 'French Roast' OR 'Hazelnut' OR 'Kona'
END
The output is:
