Administering Resource Management From the Web Console
Resource
Governor Usage Monitoring facility allows you to monitor requests
as they are submitted by users, and logs information about request
usage. This information includes the usage statistics associated
only with data retrieval or data manipulation in the case of MODIFY
or MAINTAIN. This request information is stored in Resource Governor Usage Monitoring
tables. You can specify the Monitor Preference, which allows you
to change what information is collected for monitored data sources.
The Web Console enables you to administer Resource Management.
You can:
- Enable/Disable Monitoring
& Governing.
- Maintain the
Repository.
- Reconfigure Resource
Management.
- Remove Resource Management.
- Enable/disable global
monitoring.
- Set monitoring
preferences.
- Add data sources
to be monitored.
- View the properties
of data sources and the sample data they produce.
- Access reports.
Access to these tasks is provided by the Resource Management
link on the toolbar.
x
Reference: Resource Management Tools and Context Menus
The
following image shows the Resource Management page. The navigation
pane is on the left and the Resource Analyzer/Governor and Reports
folders are expanded in the tree.
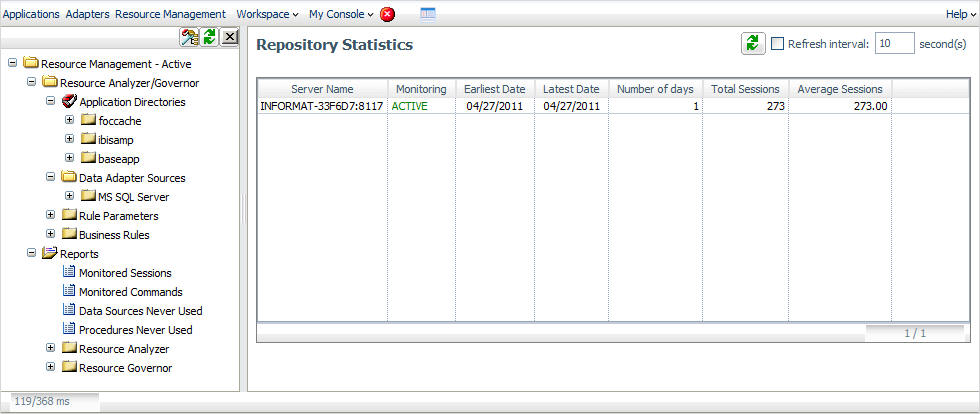
Note: The Rule
Parameters and Business Rules folders are visible because Resource
Management was configured using a license for both Resource Analyzer
and Governor.
The navigation
pane contains the following tools and context menu options. Context menus
appear when you right-click a folder or on an item in an expanded
folder.
-
Resource Management - Active/Inactive
-
-
Enable/Disable Monitoring & Governing
-
Enables or disables monitoring and governing.
Note: When
you disable monitoring and governing, the Resource Management -
Active folder will change to become Resource Management - Inactive.
-
Logs
-
Displays the following options:
-
Logging Properties. Allows
you to change logging properties, such as number of sessions and
number of days. For more information, see Resource Management Logging Properties Options.
-
Schedule Save log job. This option is only visible if
the rmlog_schedule_archive setting in Logging Properties is set
to Yes. This option allows you to specify when the archive job is
set to run.
-
Submit Save log job. Submits
a deferred execution job to archive the contents of the current
logfile (RMDATA log) to the repository.
-
List Save log job output. Allows
you to view current/previous archive jobs.
-
List non Archived logs. Gives you an option to archive
non archived log files manually.
-
Configuration
-
Displays the following options:
-
Reconfigure. Opens
the Resource Management Configuration pane where you can reset configuration
options, or change the repository type. For more information, see Resource Management Configuration Pane.
-
Change License Key. Lets you change the license key for
Resource Management.
-
Remove. Opens
the Remove Resource Management pane where you can remove resource
management products from the server.
Note: For
more information on other options that may be displayed in this menu,
see Migrating the Resource Management Repository.
-
Resource Analyzer/Governor
-
Displays the following options:
-
Properties. Opens
the Resource Analyzer and Governor Properties page where you can
set global settings and set monitoring properties. For more information,
see Resource Analyzer and Governor Properties Options.
-
Repository Maintenance displays
the following options:
-
Schedule Maintenance. Opens
a pane where a maintenance job can be scheduled to run to delete
monitored records from the repository based on a specified date
range.
-
List Scheduled Maintenance. Opens
a pane to list current or previously run maintenance jobs.
-
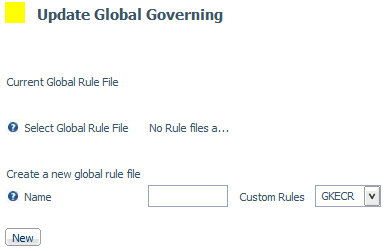
Global Governing - Active/Inactive.
Opens a pane that will update global governing.
The title on the primary menu will display Active or Inactive depending
on the current condition. To update, choose an existing rule file
and turn governing On, Off, or select Advise. The rule files available
for global governing are built with business rules only. You may
alternately create a new rule file using existing business rules, and
return to this screen after building them to set governing on. For
more information, see How to Turn Governing On and Off.
-
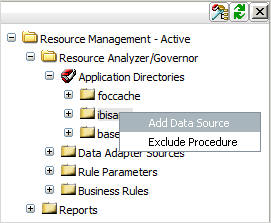
Application Directories
-
This folder contains your application directories, and each
displays a context menu with the following options:
-
Add Data Source. Opens
a pane where you can set monitoring for the data sources in the
selected application directory.
Note: Data sources that
are added from the Web Console display in the Resource Management
Console with both application directory and synonym name, for example,
ibisamp/dminv. If another synonym of the same name appears in a
different application directory, (for example, baseapp/dminv), it
will be ignored. Only the synonym in the directory you specify will
be monitored.
-
Exclude Procedure. Opens
a pane where you can select procedures to be excluded from the monitoring
process.
-
Data Adapter Sources
-
This folder is only visible if a relational adapter has been
configured. Each relational adapter folder has the following option:
-
Add Adapter Data Source. Opens
the first of two panes which allow for the filtering and selection
of relational data sources to be monitored.
Each monitored
data source has the following context menu options:
-
Properties. Displays
the current usage information and lets you change the monitor status
for the selected data source. For more information, see Resource Analyzer and Governor Monitored Data Properties Pane.
-
Verify Monitoring. Displays
sample data for the data source.
-
Delete Data Source. Deletes
the table from the list of monitored data sources.
-
Governing.
Displays
another menu option with the following options:
-
Rule Files
-
Displays a table of rule files built and available for that
data source with properties about those rules files.
-
Add Rule File
-
Displays a dialog for creating a new rule file for the data
source with data, custom, or both rules included.
-
Use Existing Rule File
-
Displays a dialog allowing the choice of connecting an existing
rule file built with business rules to the current data source.
This facilitates using a single rule file of type custom for many
data sources.
-
Rule Parameters
-
Expands to display the different shifts used
in building rules.
-
Business Rules
-
Expands to display business rules currently in
the system, or allows you to create a new one.
-
Reports
-
If you are licensed for Resource Analyzer and Resource Governor,
the available reports for both appear in the tree. If you are licensed
only for Resource Analyzer or only for Resource Governor, then only
those reports for which you are licensed will appear in the tree.
In
addition to Run, the Reports context menu
also contains Run Deferred and List Deferred. Run
Deferred prompts you for a date and time to execute
the report and submits the report to the deferred queue. List
Deferred lists the reports that have been submitted
for deferred execution.
Each selected report will first show
a filter pane where you can select the output format and data range
for running of the report.
This folder contains the following
reports:
-
Monitored Sessions. Shows
the number of user sessions by date. Session records are always
captured regardless of monitoring preferences.
-
Monitored Commands. Shows
statistics for the commands that have been monitored (TABLE, MODIFY,
SELECT, and so on).
-
Data Sources Never Used. Opens
the Unused Master File Descriptions report, which lists the data
sources which have never been used.
-
Procedures Never Used. Opens
the Procedures Never Used report, which lists the procedures which
have never been executed.
-
Resource Analyzer. Expands
to enable access to Resource Analyzer reports.
For more
information on these types of reports, see Resource Analyzer
Administrator’s and User’s Manual.
-
Resource Governor. Expands
to enable access to Resource Governor reports.
x
Procedure: How to Enable/Disable Monitoring & Governing
When
you enable Resource Management, it automatically turns on monitoring
and governing (if applicable). However, you can disable and re-enable monitoring
and governing at any time.
-
Launch the
iWay Web Console.
-
Click
the Resource Management option on the toolbar.
-
Right-click Resource
Management - Active/Inactive in the navigation pane
and select Enable/Disable Monitoring & Governing.
x
Procedure: How to Set Logging Properties
Logging
properties can be configured in the Resource Management Web Console.
When configured, the log files will be archived based on the maximum
number of sessions and days set or based on a scheduled job configured
by the administrator.
-
Launch the iWay Web Console.
-
Click the Resource Management option
on the toolbar.
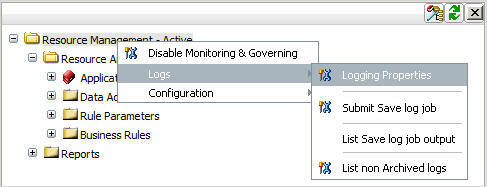
-
Right-click Resource Management - Active/Inactive in
the navigation pane, select Logs and then
select Logging Properties, as shown in the
following image.
The Resource Management
Logging Properties window opens.
-
Make your desired changes and click Save and
Restart Server. For more information on the options
available, see Resource Management Logging Properties Options.
x
Procedure: How to Submit Save Log Job
-
Launch the
iWay Web Console.
-
Click the Resource
Management option on the toolbar.
-
Right-click Resource
Management - Active/Inactive in the navigation pane,
select Logs and then select Submit
Save log job.
The Select an option dialog box opens, as shown in the
following image.
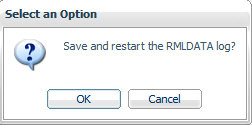
-
Click OK to
save the log data.
x
Procedure: How to List Saved Log Job Output
-
Launch the
iWay Web Console.
-
Click the Resource
Management option on the toolbar.
-
Right-click Resource
Management - Active/Inactive in the navigation pane,
select Logs and then select List
Save log job output.
The Deferred List opens showing the saved logs, as shown
in the following image.
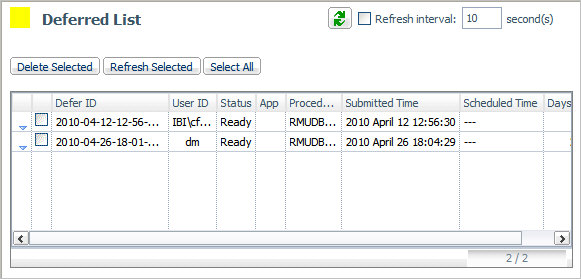
-
Right-clicking
an item in the Defer ID column provides more options. Select Get to
see the output, or Delete to delete the selection.
x
Procedure: How to List Non Archived Jobs
-
Launch the iWay Web Console.
-
Click the Resource Management option
on the toolbar.
-
Right-click Resource Management - Active/Inactive in
the navigation pane, select Logs and then
select List non Archived logs.
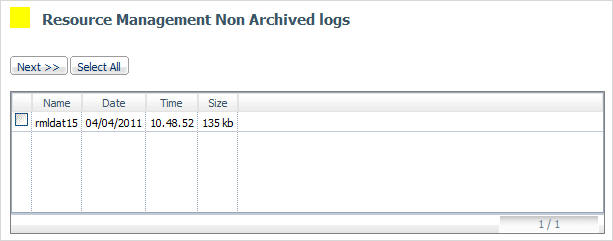
The Resource Management Non Archived logs list opens listing
the non archived logs, as shown in the following image.
-
Select a non archived log and click Next to archive
the desired non archived logs.
-
Select a date and time to archive and click Continue.
x
Reference: Resource Management Logging Properties Options
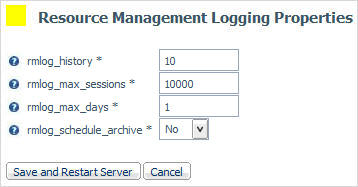
The
following image shows the Resource Management Logging Properties
window.
The following options
are available:
-
rmlog_history
-
The number of archived files kept. The default value is 10.
-
rmlog_max_sessions
-
The number of sessions recorded in the active log file before
the log is archived and a new log is started. The default value
is 10000.
-
rmlog_max_days
-
The number of days an active log file is kept open before
it is archived and a new log is started. The default value is 1.
-
rmlog_schedule_archive
-
When set to No, automatic archiving is active and based on
the two settings above.
When set to Yes, only the rmlog_history_entry
is shown and the administrator has to configure the schedule archive
settings. Selecting Yes will cause a restart of the server and you
will need to schedule the archive job.
After the server restarts,
the web console will refresh. Click the Resource Management option
on the toolbar. Right-click Resource Management - Active/Inactive in
the navigation pane and select Logs.
Select Schedule
Save log job. The Manage Schedule pane opens. Select
the Schedule the procedure checkbox to see additional
options. The recommended schedule settings are as follows:
- Schedule Type - Recurring
- Interval Type - Weekly
- In the Start and Stop fields, select the date which then will
set the reoccurring day of the week. Select the time at which the
job will start. Do not select Specify End Date.
- Leave the Special data/time ranges section blank.
- If the email notification has been configured on this server,
complete the E-mail Notification section, if required.
x
Procedure: How to Reconfigure Resource Management
You
can reset configuration options, or change the repository type used
in Resource Management.
-
Launch the iWay Web Console.
-
Click the Resource Management option
on the toolbar.
-
Right-click Resource Management - Active/Inactive in
the navigation pane and select Configuration.
-
Click Reconfigure.
The Resource Management Configuration pane opens.
-
Make your desired changes and click Configure to
save them. For more information on the options available, see Resource Management Configuration Pane.
x
Procedure: How to Change the License Key
-
Launch the
iWay Web Console.
-
Click the Resource
Management option on the toolbar.
-
Right-click Resource
Management - Active/Inactive in the navigation pane,
select Configuration and then select Change
License Key.
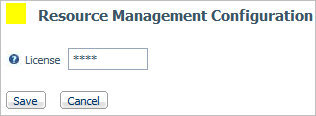
The Resource Management Configuration pane opens showing
your current license, as shown in the following image.
-
Enter the
new license into the License field and click Save.
x
Procedure: How to Remove Resource Management
You
can remove Resource Management from the server from the Resource
Management Configuration pane. This is required if you want to change
the repository type from FOCUS to relational, or vice versa.
-
Launch the
iWay Web Console.
-
Right-click
Resource Management Active/Inactive in the navigation pane.
-
Select Configuration and
click Remove from the context menu.
The Resource Management Confirmation pane opens.
-
Click Remove to
remove Resource Management from the server.
x
Procedure: How to Set Monitor Properties
Setting
monitor properties enables you to select global settings and the
component levels to be monitored. Components are split into two categories,
Procedure and Command. The information that Resource Analyzer monitors
is stored in the Usage Monitoring tables. The default settings are:
Global Data request Monitoring set to off and component level set
to Command. Session records are always captured.
To set Resource
Management Properties:
-
Launch
the iWay Web Console.
-
Click the Resource
Management option on the toolbar.
-
Right-click Resource
Analyzer/Governor in the navigation pane and select Properties.
-
Choose the
type of data to be collected from the options listed under Procedure
Log Records and Command Log Records.
For more information on this data, see Resource Analyzer and Governor Properties Options.
-
Click Save.
x
Procedure: How to Delete Monitor Data
You
can delete monitor data from the repository using the Repository
Maintenance pane.
-
Launch the
iWay Web Console.
-
Click the Resource
Management option on the toolbar.
-
Right-click Resource
Analyzer/Governor, select Repository Maintenance,
and select Schedule Maintenance.
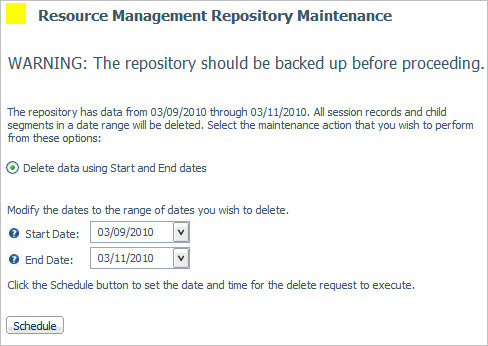
The Resource Management Repository Maintenance pane opens,
as shown in the following image.
-
Enter a Start
Date and End Date for deletion
of data through that range, or click the down arrow button on the
right of each date input box to choose the dates.
-
Click Schedule.
Note: Caution should be used when using this utility.
Make sure you have a backup of the data before you proceed.
The
Deferred Execution pane opens.
-
Enter a
date and time for the delete request to be executed. Click Continue.
A Deferred
Execution pane opens confirming your request.
x
Reference: Resource Analyzer and Governor Properties Options
The
following image shows the Resource Analyzer and Governor Properties
pane.
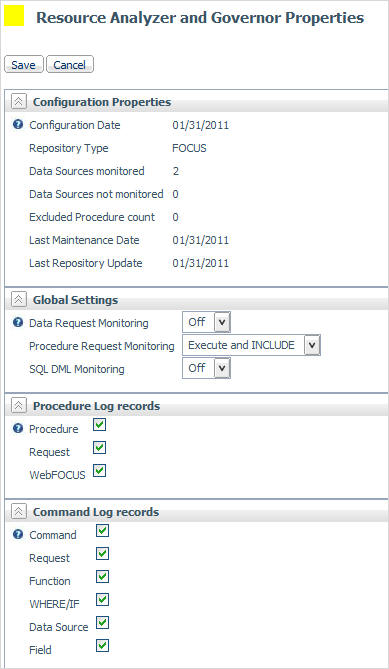
Note: By default,
all options are selected.
The Resource Analyzer and Governor
Properties pane has the following options:
-
Configuration Properties
-
-
Configuration Date
-
The date that Resource Management was configured or reconfigured.
-
Repository Type
-
The repository that is being used.
-
Data Sources Monitored
-
The number of application data sources and relational pass-thru
data sources that have been enabled for monitoring. This will show Global monitor
enabled if Data Request Monitoring is On. See the Global
Settings section below for more information.
-
Data Sources Not Monitored
-
The number of application data sources and relational pass-thru
data sources that have been disabled by setting the monitoring setting
to OFF.
-
Excluded Procedure Count
-
The number of procedures that have been excluded from monitoring.
-
Last Maintenance Date
-
The date the repository was modified using the Repository
Maintenance page.
-
Last Repository Update
-
The last time the repository updated to include data from
a log file.
-
Global Settings
-
-
Data Request Monitoring
-
Indicates whether Data Request Monitoring is on or off. When
Global Data Request Monitoring is enabled, or set to On, Resource
Analyzer or Resource Governor collects information on all SQL SELECT
and FOCUS TABLE, TABLEF, MATCH, GRAPH, MODIFY, and MAINTAIN requests.
The default value is OFF. Monitoring will be by individually selected
data sources.
-
Procedure Request Monitoring
-
Indicates the level of Procedure Request Monitoring. The
following options are available:
-
Execute and Include. All
executed procedures and any procedure that included using -INCLUDE
will be monitored. This is the default value.
-
Execute Only. Any
procedure that is execute using EX or EXEC will be monitored.
-
Primary Execute Only. The
only procedure monitored will be the primary procedure. Any procedure
executed from within the primary (-INCLUDE or EX) will not be monitored.
-
SQL DML Monitoring
-
Indicates whether SQL Data Manipulation Language (DML) is
enabled or disabled when monitoring is active. When SQL DML Monitoring
is enabled, or set to On, Resource Management will monitor SQL INSERT,
UPDATE, DELETE, CREATE, ALTER, and DROP requests in addition to
the standard data request commands. The default value is OFF. This
setting should be used to replace the use of SET SMARTMODE = DML, which
is now a depreciated setting.
-
Procedure Log Records
-
This setting allows for the customization of procedure data
to be collected. The following options are available:
-
Procedure. Contains
information on the date and time a procedure started, the elapsed
time used, the CPU time used and wait time, as well as other detailed
information about the request.
-
Request. The
actual command as executed.
-
WebFOCUS. Contains
WebFOCUS specific data such as The MR Domain, the BASEDIR value,
the APP Path used.
-
Command Log Records
-
This setting allows for the customization of command data
to be collected. The following options are available:
-
Command. Contains
information on the date and time a command started, the elapsed
time used, the CPU time used and wait time as well as other detailed
information about the request.
-
Request. The
actual command as executed. i.e. TABLE FILE CAR PRINT CAR END.
-
Function. Contains
data about aggregate functions used on fields.
-
WHERE/IF. Contains
data on the Relational tests used in a request, such as the operator
used, literals used, or date and time values used.
-
Data Source. Contains
the MFD or RDBMS table or tables used in a request.
-
Field. Contains
the field used, the type of field and whether it was used in a sort
or group.
The following table shows
the comparisons between the Monitoring settings in 7.6, and earlier
releases, and the Command Log records settings in release 7.7.
|
Release 7.6
|
Release 7.7
|
|---|
|
Monitoring Settings
|
Command Log Records
|
|
All Data
|
Select all
|
|
Query, Froms, Relations, and Columns
|
Commands, Request, Data Sources, WHERE/IF,
and Fields
|
|
Query, Froms, and Relations
|
Commands, Request, Data Sources, and WHERE/IF
|
|
Query and Froms
|
Commands, Request, and Data Sources
|
|
Query only
|
Commands and Requests
|
Note: The All Data option in release
7.6 also collects SORT and Functions. In release 7.7, SORT has been
included in Fields, and Functions has its own select box.
The
commands option in release 7.7 will also collect information about
Remote requests from a HUB-SUB configuration and, if active, Resource
Governor records.
x
Procedure: How to Turn on Global Governing
-
Launch the
iWay Web Console.
-
Click the Resource
Management option on the toolbar.
-
Right-click Resource
Analyzer/Governor in the navigation pane and select Global
Governing.
The Update Global Governing pane opens,
as shown in the following image.
x
Procedure: How to Monitor Data Sources
Data
sources must be monitored to provide monitor data, which can then
be used to analyze performance or govern usage.
-
Launch
the iWay Web Console.
-
Click the Resource
Management option on the toolbar.
-
Right-click
an application directory in the navigation pane and select Add
Data Source, as shown in the following image.
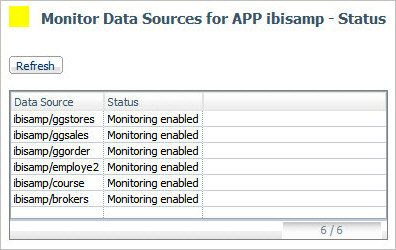
The Monitor Data Sources
pane opens to display all unmonitored synonyms in the selected application
directory, as shown in the following image.
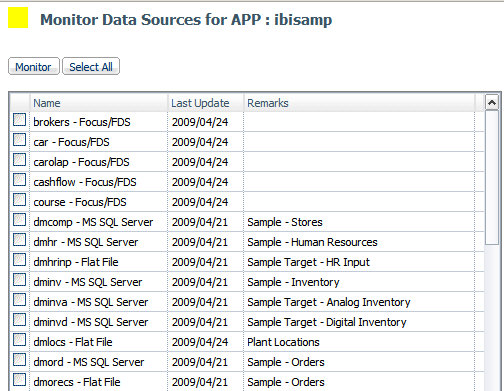
-
Select the
check box(es) for the data sources you want to monitor, or click Select
All to select all of the data sources listed.
-
Click Monitor.
The Monitor Data Sources pane reopens displaying the selected
data sources with monitoring enabled, as shown in the following
image.
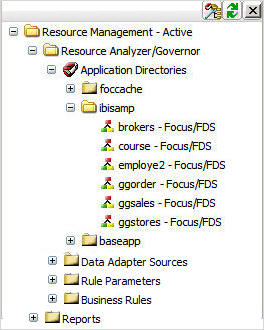
-
Click the Refresh button.
The data sources you selected now appear in the tree, as
shown in the following image.
x
Procedure: How to Monitor Relational Data Adapter Sources
Monitoring
relational data adapter sources means monitoring SQL direct passthru
requests to relational sources that do not use synonyms. Relational sources
must be monitored to provide monitor data, which can then be used
to analyze performance or govern usage.
Note: The following
procedure can only be done if a relational adapter has been configured.
To
monitor relational sources:
-
Launch
the iWay Web Console.
-
Click the Resource
Management option on the toolbar.
-
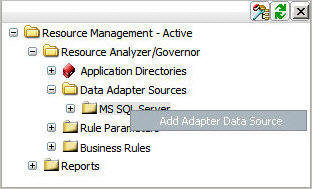
Expand the
Data Adapter Sources object in the tree, click the appropriate data
adapter, and select Add Adapter Data Source.
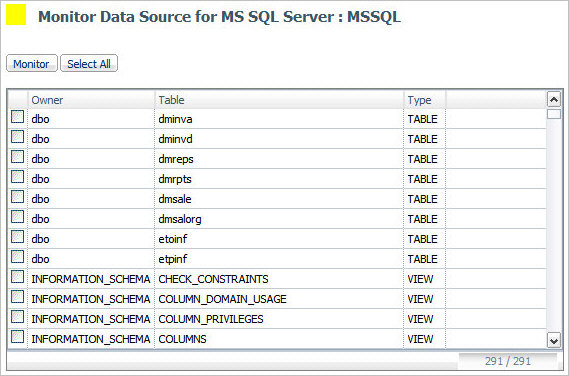
In the example shown in the following image, MS SQL Server
is the adapter selected for relational source monitoring.
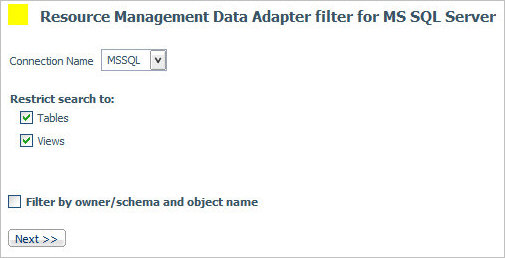
The Resource Management
Data Adapter filter pane appears, as shown in the following image.
-
If required,
select the Filter check box and provide filter
information in the appropriate fields. Click Next.
The Monitor Data Source pane opens, as shown in the following image.
-
Select
the check box(es) for the data sources you want to monitor, or click Select
All to select all of the data sources listed. Click Monitor.
The Monitor Data Sources pane reopens displaying the selected
data sources with monitoring enabled.
-
Click Refresh.
The data sources you selected now appear in the tree under the adapter folder.
x
Procedure: How to View Data Source Properties and Verify Monitoring
Verifying
the monitor status and viewing sample data enables you to determine
whether you are properly set up to access your data sources. The
following procedure applies to both Application Directories and
Relational Data Sources.
-
Launch the
iWay Web Console.
-
Click the Resource
Management option on the toolbar.
-
Expand an
application directory, or an entry under the Data Adapter Sources,
in the tree.
-
To view
the data source properties, click the Properties option
from the context menu.
The Resource Analyzer and Governor Monitored Data pane
opens. For more information on the information shown in this pane,
see Resource Analyzer and Governor Monitored Data Properties Pane.
-
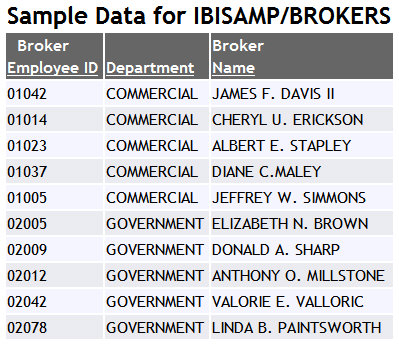
To verify
monitoring, right-click a monitored data source and select Verify
Monitoring.
Sample data from the data source appears,
as shown in the following image.
x
Reference: Resource Analyzer and Governor Monitored Data Properties Pane
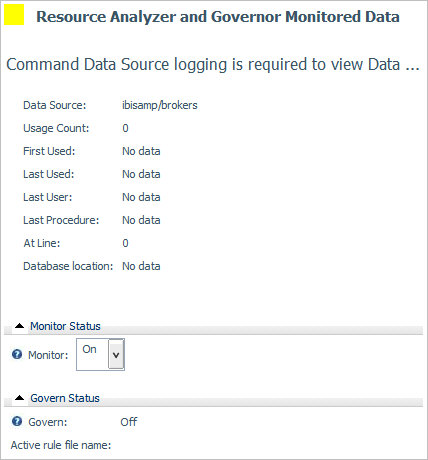
The
following image shows the Resource Analyzer and Governor Monitored
Data Properties pane.
The
Resource Analyzer and Governor Monitored Data Properties pane has
the following fields/options:
-
Data Source
-
Is the name of the application directory and synonym being
monitored in the specified application directory.
-
Usage Count
-
Is the number of times the synonym was accessed.
-
First Used
-
Is the date the synonym was first accessed.
-
Last Used
-
Is the date the synonym was last accessed.
-
Last User
-
Is the ID of the last user to run a procedure accessing the synonym.
-
Last Procedure
-
Is the name of the last procedure to run using the synonym
or is ad hoc if no procedure was used.
-
At Line
-
Is the location in the procedure where the synonym is used.
It will be 0 (zero) for ad hoc queries.
-
Database Location
-
Is the physical location of the data source. It will be blank
for relational tables.
-
Monitor Status
-
Has the following options:
-
On. Turns
monitoring for the data source on.
-
Off. Turns
monitoring for the data source off.
-
Govern Status
-
Has the following options:
-
On. Turns
governing on for the rule file in place that is displayed below
this setting.
-
Off. Turns
governing off for the rule file in place that is displayed below
this setting.
-
Advise. Turns
governing on with the advise feature for the rule file in place
that is displayed below this setting.
Note: The
rule file cannot be changed in this section. To change the rule file,
go to the Rule Files table for the data source.
x
Procedure: How to Remove a Monitored Data Source from being Monitored
You
can remove a data source from being monitored as follows.
-
Launch the
iWay Web Console.
-
Click the Resource
Management option on the toolbar.
-
Expand
an application directory.
-
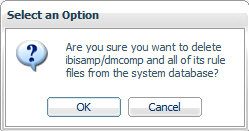
Click a
data source and select Delete Data Source.
A confirmation window opens, as shown in the following
image.
-
Click OK.
x
Procedure: How to Configure the Monitoring Data Log File
Data
log files can be configured in the Resource Management Web Console.
When configured, the log files will be archived based on the maximum
number of sessions and days set.
-
Launch the
iWay Web Console.
-
Click the Workspace link
on the toolbar, and click Configuration/Monitor.
-
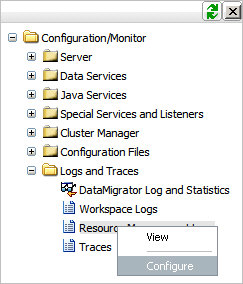
Expand the Logs
and Traces folder, right-click Resource Management
Logs, and select Configure, as
shown in the following image.
The
Resource Management Logging Properties window opens.
-
Make your
desired changes and click Save and Restart Server.
For more information on the options available, see Resource Management Logging Properties Options.