In this section: |
Resource Analyzer provides a number of graphs for resource and performance analysis.
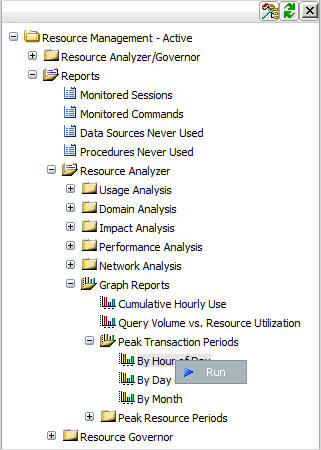
To access Graph Reports in the Web Console, click Resource Management on the toolbar and expand the Reports and Resource Analyzer folders. Expand the Graph Reports folder. Right-click the desired report, and select Run from the context menu.
The eight Graph Reports appear in the tree:
These graph reports allow you to determine transaction-bottleneck periods for request activity or resource usage by different time periods.
Click a graph report and select Run from the context menu.
The Report Filter window opens.
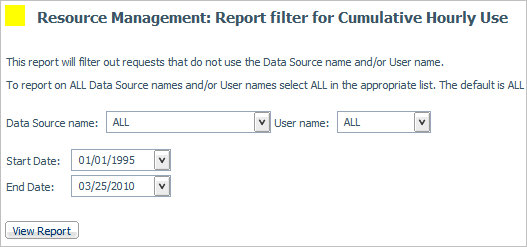
You can filter a report by data source name and/or user name by selecting a valid data source name and/or user name from the drop-down menu, or by selecting ALL, to indicate all data sources and all users. The default is ALL. After you select your data sources or accept the default, click View Report.
Un-tuned queries frequently return more data than necessary. Identify the procedures running these requests and target them for optimization.
Right-click Query Volume vs. Resource Utilization, and select Run from the context menu. After specifying report filters, click View Report.The report window opens. This report compares the number of requests to one of four factors of resource usage: CPU seconds, elapsed time in seconds, rows returned, and I/Os (all mapped on the vertical axis). This information is shown for each hour of the day, with the hours mapped along the horizontal axis. The values on the vertical axis are cumulative for the time period of the dates you select for Usage Monitoring data for reports. For more information on setting report date ranges, see Report Filters.
By default, the first graph that appears shows requests graphed against CPU seconds. To view the graph for requests versus one of the other resource factors, select the appropriate option at the top of the screen and click the Draw button. The new graph appears.
| WebFOCUS |