|
|
|
Loading Legacy Measures
|
How to: |
|
Reference: |
The following is an overview of the steps involved in designing a simple measure load.
- Access the Edit Measures panel. View the metadata and optionally save the measure you will be loading if it does not exist. For detailed information, see How to Access and Save Measure Metadata.
- Click Measure Loader.
- Select the measure for loading.
- In the Dimensions
pane, specify information in the required fields. You should:
- Determine the table from which your measures data is derived.
- Make sure you are properly mapping from the source data to the dimensions.
- Decide at what level you are going to measure each dimension.
- In the Field Maps pane, specify information in the required fields. Consider whether you are going to use a custom procedure or map on a field by field basis.
- In the Filters
pane, specify the filters for your measure.
For detailed information, see How to Design a Simple Measure Load.
- Preview the Measure Loader report. For detailed information, see Interpreting the Measure Loader Report.
- Save the measure.
|
|
|
Procedure: How to Access and Save Measures
Note: This will be deprecated in a future release.
The Edit Measure panel controls the measure series, each of which is a distinct measure, and its connected rows of values, which you can optionally link to an objective. The Edit Measure panel is accessible from the Manage page. To access data in the Edit Measure panel, perform the following steps.
- In the Manage page, click the Measures panel button.
- Select a measures source folder.
- Select
the measure for which you want to view data, for example, Employee Self Score.
The Edit Measure panel opens, as shown in the following image.
Note: To create a new measure, New.
- View the data and change field values as needed. For more information about these fields, see Manage Page - Measures.
- To save an existing prototype measure or a new measure to be loaded, click Save.
|
|
|
Reference: Manage Page - Measures
Note: This will be deprecated in a future release.
The following table lists and describes the fields and buttons in the Edit Measure panel.
|
Field |
Description |
|---|---|
|
Measure Name |
The measure you are editing. |
|
Units |
The unit of measure used for this measure. |
|
Link/Unlink Objectives... (button) |
Displays the Link Measures to Objectives panel, which enables you to link the measure to additional scorecards and objectives. For details on this panel, see How to Link or Unlink Measures. |
|
Measure Type |
Type of production measure.
|
|
Aggregation Method |
Method you can use when aggregating this measure. Choose from Additive, Percentage, Change in Percentage, or Ratio. |
|
Threshold/Flex Type |
The type of value used in the Threshold/Flex fields:
|
|
Threshold/Flex Direction |
Direction to be used to determine how thresholding is performed.
For more information about these options, see Indicator Concepts. |
|
Threshold/Flex |
In the first field, the value used for the threshold, which determines the outer range when an indicator shows red. In the second field, the value used to determine the inner edge of the yellow zone. Setting a flex of 0 indicates that the measure does not allow any deviation from the target. |
|
Threshold/Flex Slider |
Displays a grid that enables you to graphically adjust the threshold and flex values. |
|
Target |
Select the type of target you desire.
When you select Use fixed value or Aggregate fixed value, the Set Fixed Target Values button appears, which opens the Fixed Target pop-up dialog box where you can select the desired target types and enter a target value for each. |
|
Owner Id |
The owner ID currently assigned to the measure. You can select another owner to reassign the measure to that owner ID. |
|
Audit Measures
(check box) |
Select this check box to archive any changes made to the measure in the PMF measures history table, used for reporting purposes. |
|
Access Security
(check box) |
When this check box is selected, data is filtered using access security at the user's security level. |
|
Display Format |
A WebFOCUS numeric display format valid for the unit of measure. Valid format types are D (floating-point double-precision), F (floating-point single-precision), I (integer), and P (packed decimal). The formats are In, Dn.o, Fn.o, and Pn.d, where n represents the maximum number of digits to display, and .o, which is optional, and .d, which is required, represent the decimal point and the number of digits to display after the decimal point. The maximum number you can code before and after the decimal point is 10 for I, 15 for D, 7 for F, and 31 for P. For more information about numeric display options, see the Describing Data With WebFOCUS Language manual. |
|
Description |
Intuitive description of the data loaded into this measure. |
|
Measure Report |
From the drop-down menu, select an operational or PMF measure view to which users can automatically drill down. |
|
Measure Formula |
You can add a text description of the calculation method and source fields that you will use in the load procedure for this measure here. Reports use this field to prompt for actual values displayed for a measure. This field is useful to explain to constituents how a measure was calculated. |
|
|
|
Procedure: How to Adjust the Threshold and Flex Values
Note: This will be deprecated in a future release.
- On the
Edit Measure panel, click the Threshold/Flex slider button
 .
.The next pane shows the current threshold and flex values, and the percentage of the target value reached based on the most current data.
- Click
and drag the graphic for the value you want to change.
For the ascending measure shown in the following image, to set the threshold value to 15%, drag the Threshold flag to 85% on the percent ruler, stop when the Threshold flag displays 15%, and click the mouse to anchor the flag. A Flex value is set the same way. An example is shown in the following image.
The values displayed on the percent ruler are useful when setting threshold and flex values. For ascending measures, the percent values increase from left to right towards the target. For descending measures, the percent values increase from right to left towards the target. For range measures, the percent values increase towards the target and decrease in either direction away from the target.
- When you have adjusted the desired values, click Accept to save the specified values and return to the Edit Measures panel.
|
|
|
Procedure: How to Configure Predictive Data
Note: This will be deprecated in a future release.
- On the
Edit Measures panel, click the Add Predictions button.
The Configure Predictive Data panel opens, as shown in the following image, for the Sales measure series.
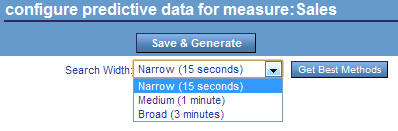
- The
Search Width drop-down menu provides choices that give approximate
wait times for generating a list of predictive forecasting methods. Select:
- Narrow (15 seconds) for the fastest search.
- Medium (1 minute) for a longer and more accurate search.
- Broad (3 minutes) for the longest and most accurate search.
- Click Get
Best Methods to calculate and display the best predictive
methods available.
The Configure Predictive Data window opens displaying a time sampling graph and a selectable list of the top 50 predictive methods.
You can scroll and select any of the other predictive methods listed in the Accuracy Method columns to display the results of that method in the time sampling graph on the panel. Compare results until you are satisfied with the selected method.
- Click Save & Generate to save the selected method and PMF will use this forecasting method to calculate predictive data for all views and reports associated with the selected measure.
|
|
|
Procedure: How to Design a Simple Measure Load
Note: This will be deprecated in a future release.
Note: If your procedures and metadata are not located in the Mainstreet application, make sure that you have added the WebFOCUS application containing them to the WebFOCUS Reporting Server APP PATH setting before you attempt a load operation. You can do this using the Web Console.
- In the Manage page, click the Measures panel button.
- Select a measures source folder.
- Select
the measure for which you want to load data, for example, Sales.
If you do not see the measure you need, you may need to define it in the Edit Measures panel. The properties displayed in all of the read-only fields in this panel can also be changed in the Edit Measures panel. For more detailed information, see How to Access and Save Measure Metadata.
The Edit Measure panel opens.
- Click the Measure
Loader button.
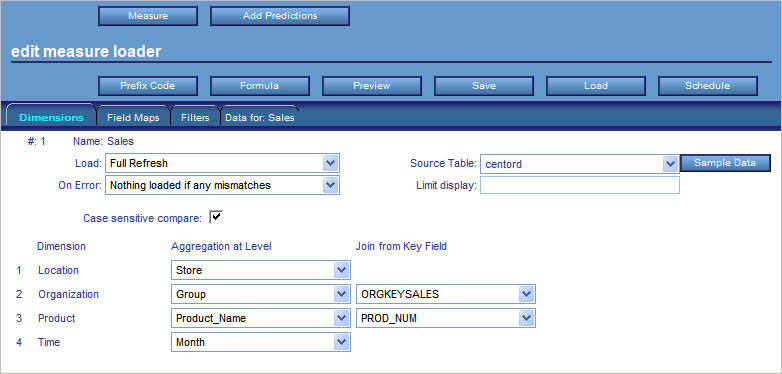
The Edit Measure Loader opens to the Dimensions view, showing the fields and options available from the Dimensions tab.
Note: The Edit Measure Loader automatically loads and displays the levels defined for the metadata and checks the measure to make sure it is correctly set up. If anything is wrong, the Load status list displays the error.
- Specify
the key values of the dimension needed to link your loaded measures
to its dimensions. You must make sure the field format matches the
key field specified when you loaded the dimension.
For more information about the available fields and options, see Manage Tab - Measure Loader Fields (Dimensions View), and Manage Tab - Measure Loader Fields (All Views).
- Click
the Field Maps tab to view your field mappings,
which appear similar to the following image.
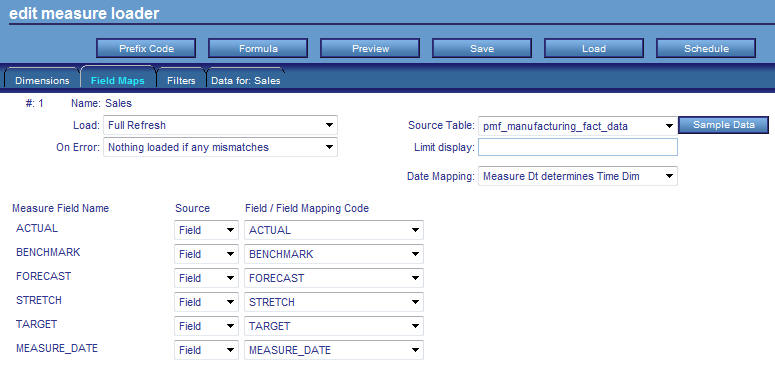
- Specify
the Field Maps required for your measure load.
Field maps determine how data from the external table is mapped into the PMF field. The target is the goal amount for the metric. Actual is the value to be evaluated against the target. You can specify a single field in the drop-down menu or type a calculation (using standard WebFOCUS formula syntax) that controls how fields from the source are processed.
For more information, see Manage Tab - Measure Loader Fields (Field Maps View), and Manage Page - Measure Loader Fields (All Views).
- Click
the Filters tab to view your filters, which appear
similar to the following image.
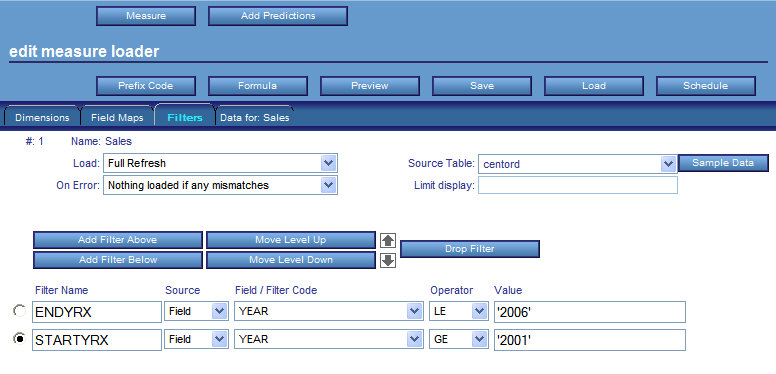
- Specify the Filters required for your
measure load.
Filters limit the rows of data to be retrieved during the load. Filters are saved and become part of the load logic.
For more information, see Manage Tab - Measure Loader Fields (Filters View), and Manage Tab - Measure Loader Fields (All Views).
|
|
|
Reference: Manage Page - Measure Loader Fields (All Views)
Note: This will be deprecated in a future release.
The following table lists and describes the fields available for all views in the Measure Loader (Dimensions tab, Field Maps tab, and Filters tab).
|
Fields |
Description |
|---|---|
|
Load |
Select one of the following options from the drop-down menu:
|
|
On Error |
Select one of the following options from the drop-down menu:
|
|
Source Table |
Allows you to select a source table or Master File for the dimension, or you can use this to select sample data you want to view. |
|
Limit display |
Type in a number of records. This does not affect loading, only the display of sample data. It improves performance of the Load Wizard. You can leave it at the default (100 records) unless you need to see a deeper data range. |
|
|
|
Reference: Manage Page - Measure Loader Fields (Dimensions View)
Note: This will be deprecated in a future release.
The following table lists and describes fields that are specific to the Dimensions view in the Measure Loader.
|
Field |
Description |
|---|---|
|
Case sensitive compare |
This option is checked, by default. When this option is checked, if there is a mismatch on the dimensionality, it will be flagged as an error in the Measure Loader report. When this option is not checked, PMF uppercases everything before comparing the dimensionality. |
|
Dimension |
Lists the type of dimension. |
|
Aggregation at Level |
Lets you select the appropriate level of aggregation for the associated dimension. |
|
Join from Key Field |
Joins a key field from the measures source table with the associated dimension source table. If there is a field in the measures source table with the same name as the key field in the dimension source table, PMF automatically selects that field as the Join from Key Field. If this is not the correct join field, use this Join from Key Field drop-down menu to select another field. This option is only available if the Separate table option is selected from the Table Type drop-down menu in the Dimension Loader. |
|
|
|
Reference: Manage Page - Measure Loader Fields (Field Maps View)
Note: This will be deprecated in a future release.
The following table lists and describes the fields in the Field Maps view in the Measure Loader.
|
Field |
Description |
|---|---|
|
Define Procedure |
Available only if Custom coding is selected as the Source Type. Select a procedure from the drop-down menu. This is the procedure that contains the defined fields you can use when you load the measure from the source data. The define procedure contains fields mapped to the ACTUAL, TARGET, and THRESHOLD series fields, as well as any component fields used in calculating these values, and any JOINs necessary to perform the calculations. |
|
Date Mapping |
If Field Mapping is selected as the Source Type, select one of the following Time dimensions from the drop-down menu:
|
|
Measure Field Name |
If Field Mapping is selected as the Source Type, the following data metrics are displayed:
If Measure Dt determines Time Dim is selected as the Date Mapping option, the following date metric is also displayed:
If you selected any of the discrete date options beginning with Time Dim, the following date metrics are displayed instead of MEASURE_DATE:
|
|
Source |
Select one of the following from the drop-down menu:
|
|
Field/Field Mapping Code |
Allows you to do one of the following:
|
|
|
|
Reference: Manage Page - Measure Loader Fields (Filters View)
Note: This will be deprecated in a future release.
The following table lists and describes the fields and option buttons in the Filters view in the Measure Loader.
|
Field |
Description |
|---|---|
|
Add Filter Below |
This button adds an additional filter level field below the filter currently selected with the option button to the left of the Filter Name. |
|
Add Filter Above |
This button adds an additional filter level field above the filter currently selected with the option button to the left of the Filter Name. |
|
Drop Filter |
This button deletes the filter level field currently selected with the option button to the left of the Filter Name. |
|
Move Level Up |
This button moves the filter level field currently selected up one level. Use the option button to the left of the Filter Name to select a filter to move. |
|
Move Level Down |
This button moves the filter level field currently selected down one level. Use the option button to the left of the Filter Name to select a filter to move. |
|
Filter Name |
Name for the filter. You can type a maximum of 50 characters. |
|
Source |
Select one of the following from the drop-down menu:
|
|
Field/Filter Code |
Enables you to do one of the following:
|
|
Operator |
Select one of the following comparisons from the drop-down menu:
|
|
Value |
Type a value in the field in single quotes (for example, '2001'). |
|
|
|
Reference: Manage Page - Measure Loader Options (All Views)
Note: This will be deprecated in a future release.
The following table lists and describes the option buttons available for all views in the Measure Loader (Dimensions tab, Field Maps tab, and Filters tab).
|
Options |
Description |
|---|---|
|
Prefix Code |
This button opens a field box in which you can type FOCUS or SQL code that will run before the measure is loaded. Click OK to save the code or Cancel to close the field box without saving your changes. If the table you are using is DBA protected, you can type the command SET USER = user_DBA_ password before you select the source table. For example, the sample Century Corp data uses the password WEBFOCUS. |
|
Formula |
This button opens a field box in which you can enter a formula for the measure load. Click OK to save the formula or Cancel to close the field box without saving your changes. |
|
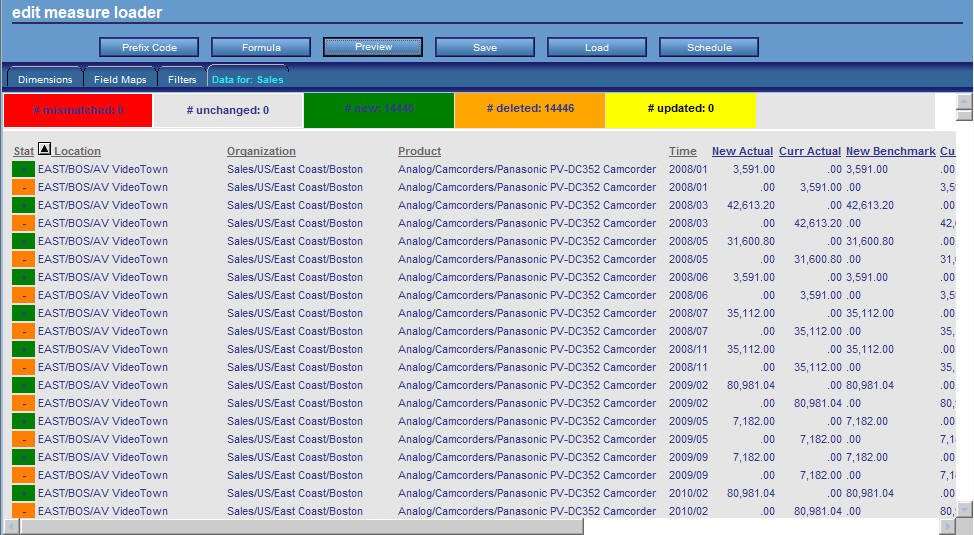
Preview |
This button runs and displays the Measure Loader report in the Data for tab of the Measure Loader. This report shows you how the load will be performed. For more information, see Interpreting the Measure Loader Report. |
|
Save |
This button saves metadata information for a measure. |
|
Load |
This button performs the measure load. Use this after you enter the appropriate information and make the proper selections in all of the required fields of the Dimensions, Field Maps, and Filters tabs. For more information, see Running a Measure Load. |
|
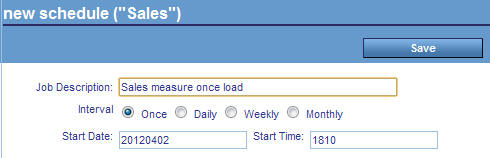
Schedule |
This button opens the measure load schedule panel, where you can schedule a one-time or recurring measure load. For more information, see Scheduling a Measure Load. |
|
Sample Data |
This button displays a report in a new browser window, showing sample data for the source table you selected in the Source Table drop-down menu. For more information, see Sample Data From Source Tables. |