A datapoint is similar to a field in a table, but with built-in
dimensional linkages. It also has linkages back to sources and forward
to measures, which provide a clear lineage from harvest point to
presentation.
x
Procedure: How to Copy Datapoints
You can make an exact copy of any existing
datapoint. After making the copy, you can immediately alter it as
needed. To copy a datapoint:
-
From the
Manage tab, click the Datapoints panel button.
-
Select the
datapoint you want to copy. The Edit Datapoint panel opens.
-
Click Save
As. You will be prompted for a new name for the datapoint,
as shown in the following image.

-
Click Save.
PMF will make an exact copy of the datapoint. You can edit and save
your changes at any time, and click Save As again
if you want to make more copies. This datapoint is what will be loaded
for editing.
x
Procedure: How to Wipe Datapoint Data
All loaded data from a derived or generated
datapoint can be wiped out or deleted in a single operation, because
they are not attached to a source.
Note: Wiping
data affects downstream datapoints for the datapoint you wipe. Every
datapoint downstream is marked as having incomplete components.
Incomplete components do not participate in recalculation.
-
From the
Manage tab, click the Datapoints panel button.
-
Select the
datapoint that needs to be deleted. The Edit Datapoint panel opens.
-
Click the Wipe
Data button. PMF will ask you to confirm the data purge.
-
Click OK.
Note: It
may take PMF a moment to purge all of the data.
xIn this section: How to: Reference: |
Derived datapoints let you create calculations that include dimensional
metadata. For example, you can create a series of derived datapoints
that perform a series of calculations on Sales performance for your
manufacturing company:
- Cost of Supply (by
Product, Location and Time)
- Cost of Labor (by
Product, Location and Time)
- Cost of Warehousing/Storage
(by Product, Location and Time)
- Cost to Ship (by
Product, Location and Time)
These datapoints can now be added up to become Total Cost (by
Product, Location and Time).
You can then set Total Cost against your Sales (by Product, Location
and Time) to calculate Profit.
You can also load precalculated Total Costs and Profit datapoints
from an external Source, but there is no guarantee the data will
be calculated in the proper order. If you use derived datapoints
to calculate the values:
- The data will be
calculated in the correct order, by using the generations in the
datapoint lineage. PMF will also recognize incomplete data and handle
it accordingly.
- You will be able
to deconstruct the calculations performed for all derived datapoints using
Lineage Chains.
Lineage Chains are currently available in the
Lineage tabs on dimensions, sources, datapoints, and measures panels.
- Derived datapoints
allow deep models of recalculation, that let many measures share
the same common root calculated values.
- Derived datapoints
let you mix and match any data source in one contiguous data mart,
and are much easier to set up than ETL jobs. This is because dimensional aggregation
logic is included in the calculations, so you do not have to write
complex dimensional logic in an ETL tool.
x
Procedure: How to Create a Derived Datapoint
To create a derived datapoint:
-
In the Manage
tab, click the Datapoints panel button.
-
Click New.
The New Datapoint panel opens.
-
Name the
new derived datapoint.
-
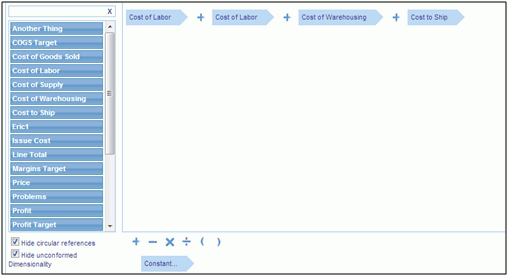
Drag the
datapoints you need for your calculation into the canvas. Each datapoint
must be separated by its operation, as shown in the following image.
Calculations
can also include constants. To add a constant, drag the Constant object
into position on the canvas, and type in the constant value inside
the Constant object.
Separate datapoints for WebFOCUS functions
are typically created during the source load, since capturing these
calculations is done best in the first-generation in the lineage,
during harvesting.
For example, if you want to capture counts
of a particular condition, rather than trying to save all those
attributes somewhere so you can perform the filtering later, you can
determine When, that is what filters should be true, for the count.
You can then pull that count into a loadable datapoint. Approaching
data this way allows you to make calculations in the lineage after
this harvesting phase simpler for you to manage.
-
Click Save.
If the calculation is not complete, PMF recognizes this, and marks
the derived datapoint as Incomplete. Incomplete derived datapoints
do not participate in recalculation.
x
Creating Calculated Measures With Derived Datapoints
PMF allows you to create an unlimited number of calculations
for your measures using special datapoints that store and process
calculations, known as derived datapoints. These calculations can
be based on one or more existing datapoints, of any kind, including loadable,
user-entered, generated, and other derived datapoints. Note the following:
- If you create a derived
datapoint that uses data from loadable, user-entered, or generated
datapoints, PMF will recalculate the results every time the data
for these are changed. The data goes through the lineage, through
all your steps of calculation, until it is copied to any measures
linked to your datapoints.
- If you create a derived
datapoint that uses data from another derived datapoint, PMF knows
that the “parent” derived datapoint must be calculated before calculating your
new derived datapoint. Logic built into PMF understands that calculations
must use generations in the datapoint lineage.
Recalculating
a complex lineage chain through possibly hundreds of thousands or millions
of row values can be an expensive operation, so you have full control
over how much of this calculation is performed during normal processing
hours.
Note: During scheduled load cycles, since PMF
is less used during scheduled load times (usually overnight), recalculation
can always go through the entire lineage.
x
Reference: Previewing Derived Datapoints
You
can preview the data that PMF will generate by clicking the Preview tab,
as shown in the following image.
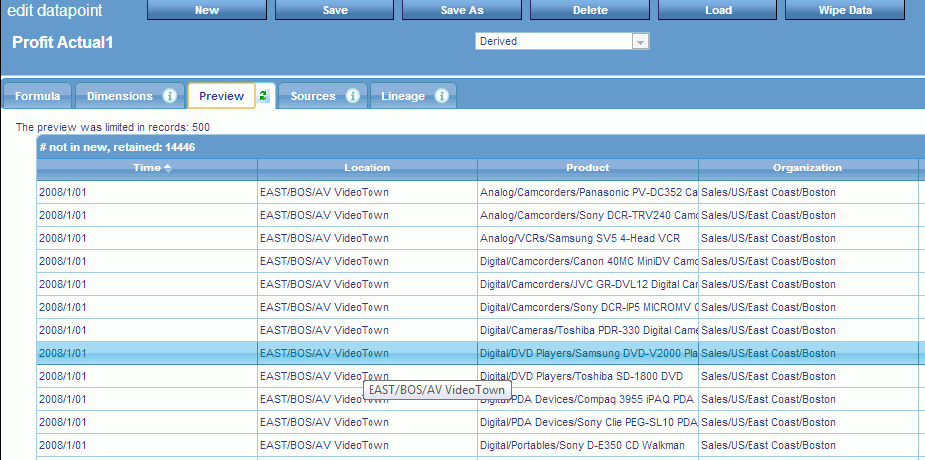
The
Preview tab generally shows rows that are new, or will be updated
or deleted.
Tips:
- The Preview tab shows
data to be handled before any operations occur. It divides this
data up into the following sections, based on what will happen to
the rows that are displayed:
- New rows to be created by generation.
- Rows to be updated by generation.
- Rows to be deleted by generation (depending on the Wipe Data
setting on Advanced tab).
- Rows that will be kept but whose values do not match the new
data to be generated (depending on the Wipe Data setting on the
Advanced tab).
- Opening the Preview tab will force the navigation bar to close,
in order to use as much screen width as possible. You can reopen
it by clicking the expand button at the top of the navigation bar.
- You can resort the preview contents in any order by clicking
the column headings. Note that the Preview will show data based
on the display limit set in the Load settings. To change this value,
see Load Settings.
x
Reference: Lineage and Recalculation With Derived Datapoints
Derived datapoints can have a complex,
multi-part lineage, depending on their relationship to other derived
datapoints.
- In the lineage directionality
of derived datapoints, the data in derived datapoints always progresses
to the left, from first-generation datapoints (loadable, user-entered,
and generated) toward measures.
- PMF automatically
handles figuring out the generation of each derived datapoint in the
lineage, by analyzing the first point in the lineage where a derived
datapoint sends its data onward.
x
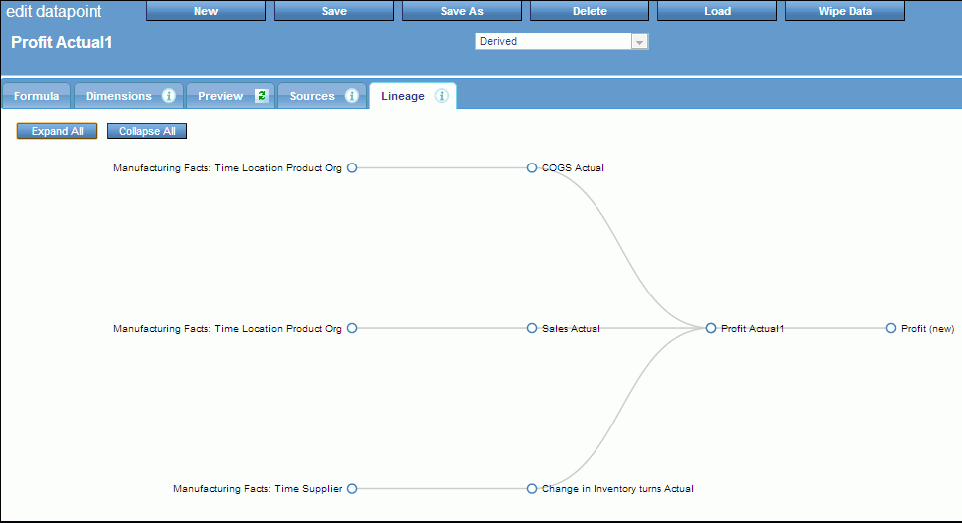
Reference: Derived Datapoint Lineage Tab
You
can view lineage for all datapoints for any derived datapoint. Lineage
shows the progress of data through PMF, from the external data harvested
into datapoints, through any derived datapoints, and finally all
terminal points in Measures. The Lineage tab displays the components
in the generated source by default, as shown in the following image.
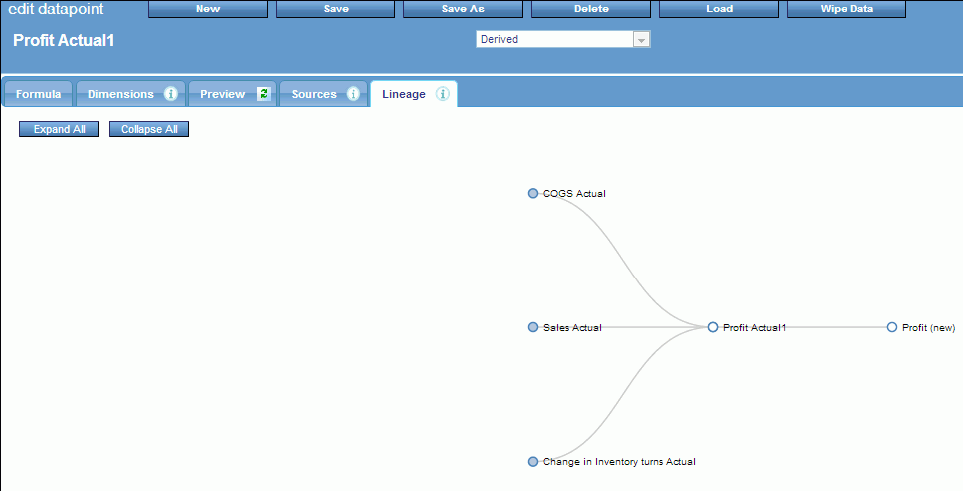
You
can click on any node to expand it and display the contribution
of that node to the lineage. You can also click Expand
All or Collapse All to display
or hide the entire lineage, as shown in the following image.
xIn this section: How to: Reference: |
Generated datapoints enable PMF to create sample data for your
models. With generated datapoints, you can:
- Tell PMF the maximum
and minimum values to generate.
- Specify which dimensional
intersections should contain the generated data.
- Use different sampling
methods to generate the data.
Generated datapoints are designed for the following situations:
- When you need to
demonstrate metrics in dashboards, but have nothing but a rough
idea what the data should look like.
- When a sponsor can
give you more specific guidelines as to the data they want to see,
but you do not want to spend hours modeling the data in a tool.
- When you are creating
a new metrics model, and want to spend your time on it, rather than
on the data.
Important: Generated data should never be treated as real
performance data. PMF 5.3.2 does not yet mark generated data as
“unreal,” so use generated datapoints only for non-production work.
x
Procedure: How to Create a Generated Datapoint
To create a generated datapoint:
-
In the Manage
tab, click the Datapoints panel button.
-
Click New.
The New Datapoint panel opens.
-
Select Generated from
the first drop-down menu.
-
Name the
new datapoint.
-
Click the Dimensions tab
and specify the dimensions and levels for which PMF will generate
data, as shown in the following image.
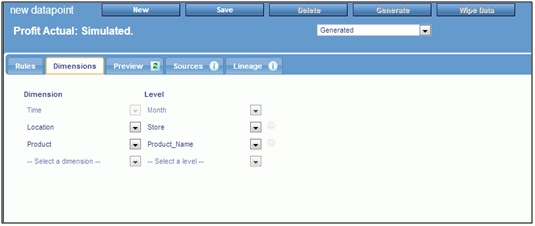
Setting
dimensions affects some options on the Rules tab, so if you know
the dimensions you want to use for generating, set them first.
-
Click the Rules tab
and specify the rules PMF should use to generate data. The following
options are available:
-
Decimal Format
-
Specifies the decimal format of the data generated:
- The first character
can be D (Decimal) or I (Integer).
- The next characters
are numbers to specify the total length of the field.
- You can indicate
a period and number of digits of decimal precision.
Examples
of typical decimal formats are: D12.2, I8, D20.6 and, I32.
-
Method
-
Controls how PMF will calculate the sample values:
-
Normal (Bell Curve) Distribution. PMF
generates a range of values that favors the center of the numeric
range you type in under Lower/Upper Bounds.
-
Uniform Random Distribution. PMF
generates an even distribution of values that favors no point in
the numeric range.
-
Lower/Upper Bounds
-
The lowest and highest number for the range of possible values
PMF will generate. The numbers will be formatted using the mask
you entered in the Decimal Format field.
-
Data Sparsity
-
Controls the amount of data PMF generates by letting you
focus the data on dimensional choices:
-
None. Generates
a Cartesian cross-product of all possible dimension values.
-
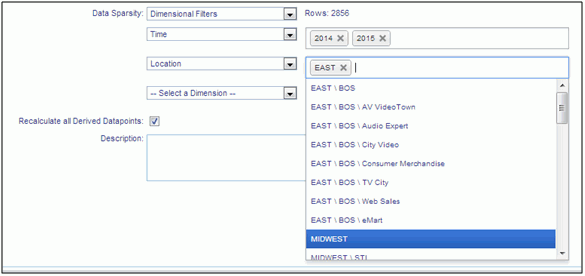
Dimensional Filters. You
can specify filters for the dimension levels for the generated datapoint.
To specify the filters, select this option and use the drop-down
menus, as shown in the following image.
-
Train. You
can base the dimension level values along which PMF generates data
on another datapoint. This lets you keep a limited amount of data together.
You
can specify any datapoint to train from a loadable datapoint, user-entered datapoint,
derived datapoint, or another generated datapoint.
-
Recalculate all Derived Datapoints
-
This option should remain enabled, unless you have a very
large data mart and want to reserve recalculation for overnight
or other offline processing.
Note: This option enabled
by default. To disable it, see Load Settings.
-
Description
-
A description of the datapoint.
-
Click Save.
If minimum necessary entries are not set up to generate data, PMF
will mark the generated datapoint as incomplete. Incomplete components
do not participate in recalculation.
Tips:
- When generating random
data for generated datapoints, PMF will wipe all existing data before
regenerating it using your new rules. Generally, with generated datapoints,
the Preview tab is useful for new data you are planning to generate
into an empty datapoint, or when changing rules. If your rules have
not changed, and data is showing up on Preview as 100% added and
deleted, you should not regenerate data.
- If you are modeling
a new metrics system without having any real data to work from, you
will have no data loaded at all into PMF to train from. In this
situation, set the Dimensional Filters option on your first generated
datapoint, specify the dimensions, and have PMF generate the data.
You can then train loading all of your generated datapoints to load
based on that one datapoint.
x
Reference: Lineage and Recalculation With Generated Datapoints
Generated Datapoints are primary sources
for data in PMF. They are treated as first generation in any lineage,
along with loadable datapoints and user-entered datapoints.
x
Promoting a Generated Datapoint
Generated datapoints are used when you lack real data to prove
that your model works, or they are needed for a demonstration. Once
you are ready to use a working model with real data, generated datapoints
are no longer necessary to feed your metrics.
To promote the generated datapoint:
- Add it to a loadable
source so that its data can be harvested from an existing file,
table, or view.
- Add it to a user-entered
source, so that the data can be collected from end users.

