A source allows you map inbound data to PMF elements called datapoints
that will become elements in measures, such as Actual, Target, and
so on.
x
Procedure: How to Wipe Source Data
All
loaded data from a loadable, user-entered, or generated source can
be wiped out or deleted in a single operation. This is useful when
you have loaded data that is invalid. It is a simple way to delete
all the data.
-
From the
Manage tab, click the Sources panel button.
-
Select the
source that needs data to be deleted. The Edit Source panel opens.
-
Click the Wipe
Data button. PMF will ask you to confirm the data purge.
-
Click OK.
Note: It
may take PMF a moment to purge all of the data.
x
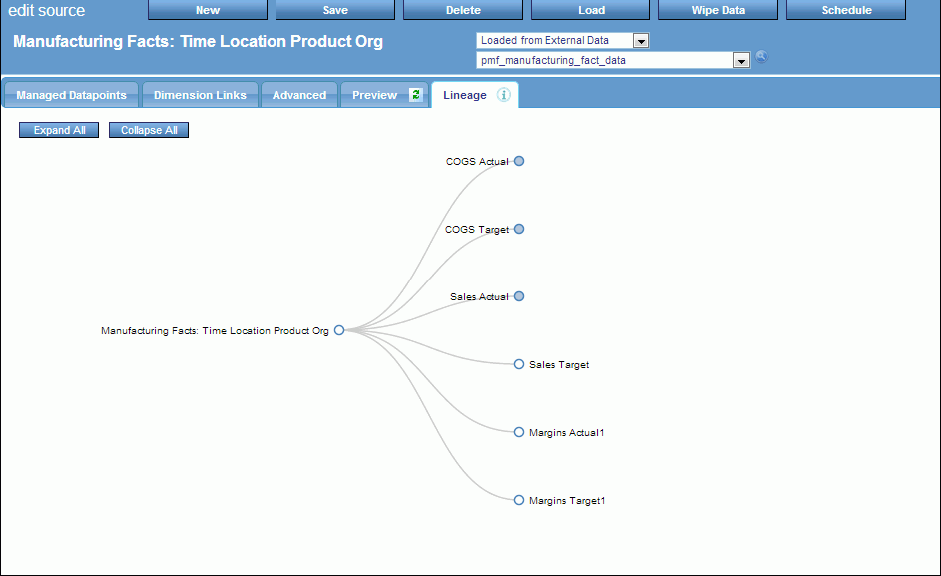
You
can view the lineage for all datapoints for any loadable, user-entered,
or generated source by selecting the Lineage tab
in the New Source or Edit Source panel. Lineage shows the progress
of data through PMF, starting from the external data harvested into
datapoints, through any derived datapoints, and finally, all terminal points
in measures.
The following image shows an example of the
Lineage tab for a loadable source.
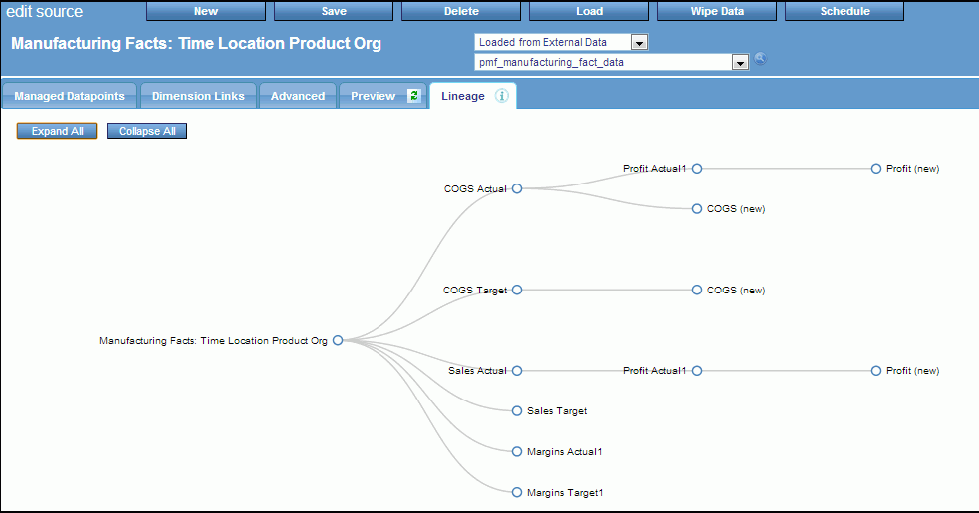
You
can click on any node to expand it and display the contribution
of that node to the lineage. You can also click Expand
All or Collapse All to display
or hide the entire lineage, as shown in the following image.
xWorking With Loadable Sources
Loadable sources in PMF:
- Let you harvest data
from external data tables, views, flat files, Excel files, and so
on. Typically, you would define a loadable source for every single
separate and distinct physical data source from which you wanted
to acquire metric data. For more information on harvesting data,
see Data Harvesting Loadable Sources.
- Allow immediate loading
of data, or you can load data on a schedule.
- Contain one or more
loadable datapoints each. A loadable source is a logical grouping
of datapoints that all come from the same physical data location.
x
Reference: Data Harvesting Loadable Sources
Data
harvesting is the process of taking data from a source and processing
it into information that is then loaded into one or more datapoints
needed by the PMF source.
Note: The result of any data harvesting
operation is always numeric.
Typical data harvesting actions
are:
- Summarizing aggregated
values of an inbound numeric field.
- Summarizing values
of an inbound numeric field, but only if certain conditions are true.
Otherwise, they are ignored.
- Counting occurrences
of a particular set of field conditions (Counting when).
- Distinctly counting
occurrences of a particular set of field conditions. Distinct counting
is a method to prevent double-counting fixed assets, people, and
so on.
- Writing a custom
load for a datapoint, where the logic is freeform. For example,
it is possible to perform custom operations or calculations on the
data inbound or implement more complex or nested filters. These
use WebFOCUS programming logic, functions, and operations. The PMF
source loader allows all the data harvesting methods above.
In
PMF, all data harvesting is done across a potential Cartesian cross
product of dimensional intersection. Nearly every load involves
a fairly high degree of sparsity against this cross product, but
in most cases, it also involves creating multiple records that follow a
particular pattern against the source data.
In many cases,
depending on the degree of granularity of the inbound loadable data from
the source, PMF requests the data to be aggregated even when loaded
at the lowest level of its dimensionality. This happens when the
physical data table or view contains more detailed records that
go to a lower logical level than the source requests. Some examples of
this are:
- If the physical data
of the source is stored at a daily or hourly level, and the source
load needs it summarized at a monthly level.
- If there is a location
dimension, and the source stores data at the geocode or ZIP code
level, and the PMF source wants this data at the city or regional
level.
In the examples listed, the PMF loader will be
aggregating records from the source inbound during the load process.
x
Reference: Lineage and Recalculation With Loadable Sources
Loadable
Sources are primary sources for data in PMF. PMF treats them as first
generation in any lineage, along with user-entered datapoints and
generated datapoints.
Loadable
data is treated as updated on the date of load, but is effective
as of the time dimension linkages for the data.
x
Procedure: How to Set Up Loadable Sources and Datapoints
To
set up a new Loadable source:
-
In the Manage
tab, click the Sources panel button.
-
Click New.
The New Source panel opens.
-
Name your
new source and select Loaded from Data Source from
the first drop-down menu, as shown in the following image. This
option lets PMF know that you want this source to harvest data from
an existing table, view, flat file, and so on.

-
Select the
metadata file for the existing table from the second drop-down menu.
If the file you want to use is not listed, expand the File Picker
by selecting Show More... from the drop-down
menu.
The FIle Picker allows you to look at all of the available
metadata files in your currently configured WebFOCUS app path. The
icons to the left of each file name let you explore the contents
of the file to make sure that it is the correct one. To select the
file to use, click the name once and close the File Picker.
-
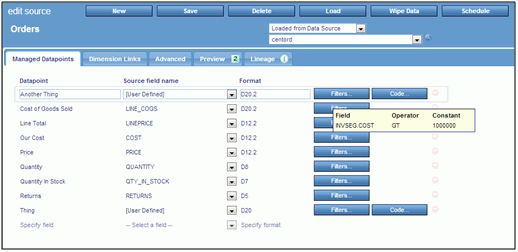
Specify
the datapoints to be harvested. For each line where you want to add
another field from the source, you can do the following:
- To harvest by summarizing
the values of the field, select the field you want to harvest
from the Source field name drop-down menu. You can use the default
name assigned to the datapoint, or change the name at anytime.
- To harvest by summarizing
the values of the field only when conditions are matched, select
the field you want to harvest from the Source field name drop-down
menu and create filters by clicking the Filters button to
choose your filters.
- To harvest by counting,
select [Count] from the Source Field Name
drop-down menu and specify the conditions to count by clicking the When button.
You are required to provide a name for the datapoint.
- To harvest by counting
distinctly, select [Distinct Count] from
the Source Field Name drop-down menu. Specify the conditions to
count by clicking the When button, and specify
the matching field for distinct counting. You are required to provide
a name for the datapoint.
- To create a custom
formula for calculating the field during harvesting, select [User
Defined]. Specify filters to be used by clicking the Filters button
and specify the WebFOCUS code-based formula for harvesting the field
by clicking the Code button. You are required
to provide a name for the datapoint.
Your datapoints
should look similar to the following image.
Note: You
can save your work-in-progress at any time. PMF will not be able
to actually harvest data into the datapoints that were set up until
the needed harvesting details and dimensionality have been specified.
-
Click the Dimension
Links tab and specify Time, as well as other dimensional
linkages, as shown in the following image.

Note: The
fields you select for dimensional linkages must contain values that
match up to those you loaded for the dimension keys in the Dimension
Loader. PMF will alert you if there is an issue.
-
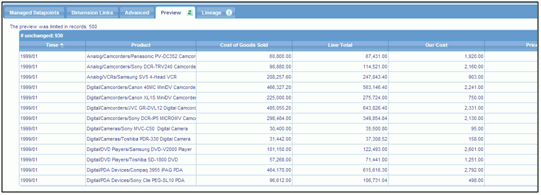
Once the
dimensional linkages are set up, click the Preview tab.
The data that is being set up for harvesting can be seen, as shown
in the following image.
Note:
- The Preview pane
is very flexible and shows the row values that will be added, changed,
or deleted from your source, in separate sections.
- You can resort the
contents of the Preview pane by clicking a column heading. The sort
toggles between ascending and descending order.
- You can scroll the
Preview pane vertically and horizontally, and drag the navigation
bar divider to make more room onscreen.
- You can refresh the
Preview pane at any time by clicking the Refresh button
on the Preview tab.
- You can switch back
and forth between the Datapoints, Dimension Links, and Preview tabs
to alter the patterns you are using for harvesting, adjust the linkage keys
and dimensions that you are linking to, and refresh the preview,
as needed.
-
Click Save before
concluding your session to ensure that the datapoints and source
you have set up are correctly stored in the system. After saving
the data, you can click Load to harvest initial
data for your new source.
x
Procedure: How to Update a Loadable Source
To
update a loadable source:
-
From the
Manage tab, click the Sources panel button.
-
Select the
source you want to update. The Edit Source panel opens.
-
Make the
desired changes. You can rename the datapoints, change their field
linkages, format, filters, when conditions, or code. You can also
revise dimensional linkages and change Advanced properties of the
source.
-
Click Save when
you are done making edits. PMF will perform the actions on the source
and/or save the changes into each datapoint for the source.
x
Procedure: How to Change the File, Table, or View Used for a Loadable Source
If
the name of the Master File or other physical connection information
used by a loadable source changes, you can adapt those changes into
the source in PMF.
-
From the
Manage tab, click the Sources panel button.
-
Select the
source you want to edit. The Edit Source panel opens.
-
Select the
new Master File for the new data source you want to use from the
drop-down menu. PMF will automatically clear the fields from the
data source, so you can choose the correct new ones from your new
source.
-
Click Save to
save your changes.
xWorking With User-Entered Sources
In this section: How to: Reference: |
User-entered sources in PMF:
- Let you harvest data
from groups of your end users. Typically, you define a user-entered
source for every single separate and distinct physical group of
inputs from which you acquire metric data among your users.
- Allow updating measures
on a recalculation schedule. You can also recalculate during normal
daytime processing, if you wish.
- Contain one or more
user-entered datapoints. A user-entered source is a logical grouping
of datapoints that all come from the same subject matter or groups
of users.
User-entered sources let you collect data from groups of end
users.
- These are typically
needed when your measure data is not an actual source in an existing
data source, but is entered ad hoc.
- User-entered sources
let you harvest data from these users and operationalize that data
in PMF, without requiring any intermediate files, such as flat files
or Excel files.
- Apps do not need
to be built to collect this data. PMF provides an easy-to-use, lightweight,
fast, online, spreadsheet-like user interface, with full validation,
that can instantly display within the browser of any end user.
x
Procedure: How to Create a User-Entered Source
-
From the
Manage tab, click the Sources panel button.
-
Click New.
The New Source panel opens.
-
Name the
source, and from the first drop-down menu, select Entered
by Users. This lets PMF know that the source will harvest
data from the user-entered source.
-
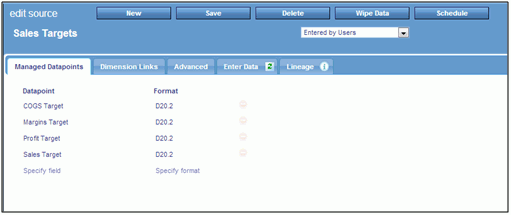
Define each
user-entered datapoint for this source by entering a name and format
for each datapoint. You can quickly enter this information by pressing
the Tab key to move from field to field. You can create multiple
user-entered sources, and each user-entered source can represent
all the datapoints you would collect from a particular user population.
For example, if you are collecting input from HR staff
for HR metrics, you could create a user-entered source called HR
Input, and in that source, you could define the datapoints to be
collected from that group.
For each datapoint you define,
you can also define the numeric validation format. The PMF input
facility will enforce that data format during collection, as shown
in the following image.
Note: You
can save your work and leave the session at any time. If all the steps
are not completed, the Source panel will mark this source as incomplete.
End users will not be able to enter data until the source is complete,
and incomplete components do not participate in recalculation.
-
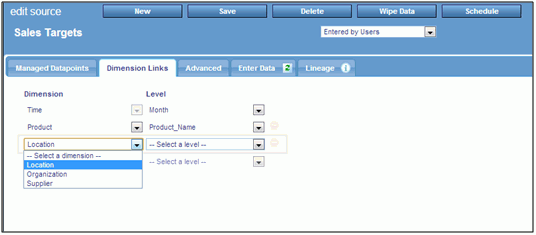
Click the Dimension
Links tab and define the dimensionality to be collected
for the user-entered datapoint. Select the dimensions and levels
to link for each, as shown in the following image.
-
Click Save.
-
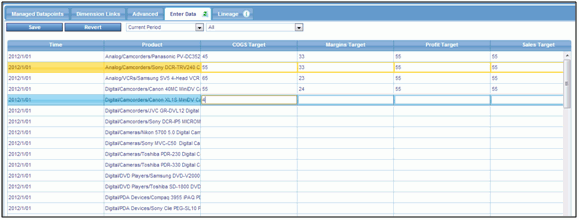
Click the Enter
Data tab to view the data structure or input data, as
shown in the following image.
If
data entry is already displayed, click the Refresh button to
refresh the contents in the Enter Data tab.
In this tab, PMF
displays the rows that are ready to receive data from input and allows
you to enter data.
- You can sort the contents of the Enter
Data tab by clicking the column headings. The arrow next to the
heading tells you the direction of the sort.
- You can click on any row or column to highlight it and get a
more detailed view.
- You can resize the columns by dragging its borders in the headings.
Click
the small Save button within the Data Entry
tab to save the data you entered into the individual datapoints
on the Data Entry tab.
Note:
- If you leave any
open boxes blank, PMF will not create an intersection for them.
That intersection will be treated as a NULL, for example, MISSING.
- Zeros entered will
be treated as entered data, and an intersection will be created.
- If you blank out
an entered number, its intersection will be deleted when you click Save.
x
Reference: Lineage and Recalculation With User-Entered Sources
User-entered
data differs from standard loaded data in the following ways:
Note: User-entered
data is treated as updated on the date of entry, and the downstream
datapoints and measure copies are treated as loaded on the day they
were scheduled to update.
x
Updating User-Entered Sources
You can update user-entered sources at any time. PMF adjusts
existing user-entered data for the datapoints in a user-entered
source as follows:
- Changing the name
for any datapoint causes the datapoint to be renamed, with no side
effects.
- Adding new datapoints
causes them to be added to the source, and to take on the dimensional
linkages already configured for that source.
- Changing the format
for any datapoint has no effect on the underlying data, because
PMF stores all numbers internally in floating-point format. If you
change the numeric format to remove or shorten the mantissa (for
example, changing the format from D12.2 to D12) when the data is
redisplayed for entry, PMF will automatically truncate the mantissa
when the data is saved. This might have an effect on values shown
for measures on various views and charts in PMF.
- Adding dimensional
linkages causes PMF to wipe the data. This is because PMF does not
know how to reallocate data that has already been entered.
- If the dimensional
level is changed to a lower level for any linked dimension, it causes
PMF to wipe the user-entered data for the datapoints. This is because
PMF does not know how to reallocate the rolled-up data. The individual
dimension-linked values will be lost.
- If the dimensional
level is changed to a higher level, PMF attempts to roll the data up.
Once the rollup is completed, changing the level back to a lower
one will cause PMF to wipe the data, for the same reason as above.
xWorking With Generated Sources
In this section: How to: Reference: |
Generated sources in PMF enable you to:
- Indicate to PMF the maximum and minimum values to generate
for each datapoint in the source.
- Specify which dimensional intersections should contain the generated
data.
- Use different sampling methods to generate data.
Generated sources enable PMF to automatically create sample data
for your models. They should be used in the following situations:
- When you need to demonstrate metrics in dashboards, but
only have a rough idea what the data should look like.
- When a sponsor can give you more specific guidelines as to the
data they want to see, but you do not want to spend time modeling
the data in a tool.
- When you are creating a new metrics model, and want to spend
your time on it, rather than on the data.
Note: Data that is generated should not be treated as
real performance data. PMF Release 5.3.2 cannot distinguish between
generated and performance data, so use generated sources only for
non-production work.
x
Procedure: How to Create a Generated Source
-
From the Manage tab, click the Sources panel
button.
-
Click New.
The New Source panel opens.
-
Name the source, and from the first drop-down menu, select Generated
(sample data). This indicates to PMF that the source will
be generated automatically.
-
Define each datapoint that you want to create. As you
enter each datapoint, PMF will set default rules to be used between
the generated source and datapoint. You can quickly enter this information
by pressing the Tab key to move from field to field.
If you choose to specify the rules that PMF should use
to generate data, the following options are available:
-
Decimal Format
-
Specifies the decimal format of the data generated:
- The first character can be D (Decimal) or I (Integer).
- The next characters are numbers to specify the total length
of the field.
- You can indicate a period and number of digits of decimal precision.
Examples
of typical decimal formats are: D12.2, I8, D20.6, and I32.
-
Method
-
Controls how PMF will calculate the sample values:
-
Normal (Bell Curve) Distribution. PMF generates a range
of values that favors the center of the numeric range you type for
Lower/Upper Bounds.
-
Uniform Random Distribution. PMF generates an even distribution
of values that favors no point in the numeric range.
-
Lower/Upper Bounds
-
The lowest and highest number for the range of possible values
PMF will generate. The numbers will be formatted using the mask
you entered in the Decimal Format field.
Note: You
can save your work and leave the session at any time. If minimum
necessary entries are not set up to generate data, PMF will mark
the generated source as Incomplete. Incomplete sources and their
datapoints do not participate in recalculation. You need to complete
the source to allow its datapoints to participate, or you will not
be able to get the data published using measures.
-
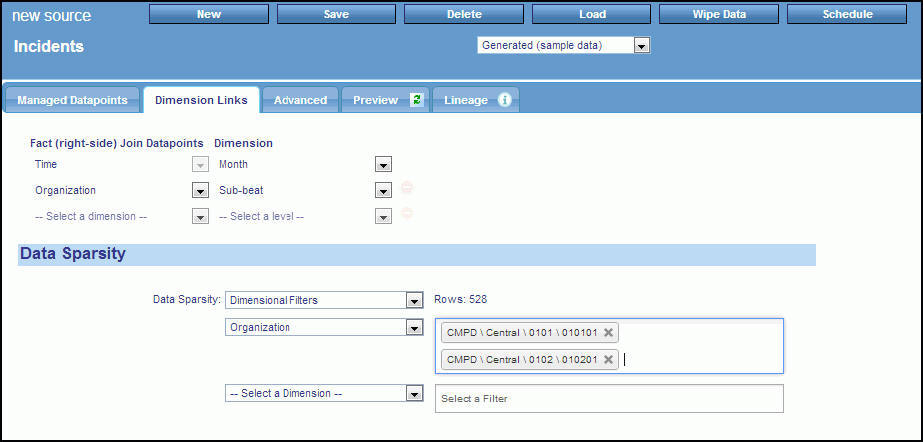
Click the Dimension Links tab
and define the dimensions and levels for which PMF will generate
data. This will affect some options in the Rules tab, so perform
this step next if you know the dimensions you want to use for generating,
as shown in the following image.
The
following option is available:
-
Data Sparsity
-
Controls the amount of data PMF generates by letting you
focus the data on dimensional choices:
-
None. Generates
a Cartesian cross-product of all possible dimension values.
-
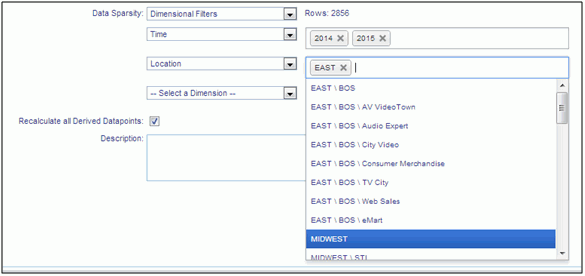
Dimensional Filters. You can specify filters for the
dimension levels for the generated datapoint. To specify the filters,
select this option and use the drop-down menus, as shown in the
following image.
-
Train. You can base the dimension level values along
which PMF generates data on another datapoint. This lets you keep
a limited amount of data together.
You can specify any datapoint
to train from a loadable datapoint, user-entered datapoint, derived
datapoint, or another generated datapoint.
-
Click Save.
x
Procedure: How to Update a Generated Source
To update a generated source:
-
From the Manage tab, click the Sources panel
button.
-
Select the source you want to update. The Edit Source
panel opens.
-
Make the desired changes. You can rename or delete datapoints, change
the generation method or values for any datapoint, or delete the
entire generated source.
Note:
- Datapoints are included in formulas
and linked to measures by reference. Renaming them will percolate
through the entire system.
- Altering the generation method formula or the range values for
a generated source automatically flags its data, and any later generations
in the lineage for that Generated Source (including child derived
datapoints and measure values) for a one-time wipe. If the data
is also scheduled for reload, PMF performs that load after wiping
the data.
-
Click Save when you are done making
edits. PMF will perform the actions on the source and/or save the
changes into each datapoint for the source.
x
Reference: Lineage and Recalculation With Generated Sources
Generated sources are primary sources
for data in PMF. As such, PMF treat these source types as first
generation in any lineage, along with loadable and user-entered datapoints.
x
Promoting a Generated Source
Generated sources are used when you lack real data to prove that
your model works, or they are needed for a demonstration. Once you
are ready to use a working model with real data, generated sources
are no longer necessary to feed your metrics.
To promote the generated source:
- Add it as a loadable source so that its data can be harvested
from an existing file, table, or view.
- Add it to a user-entered source, so that the data can be collected
from end users.
x
Reference: Specifying Dimensional Filters
If you have three or more dimensions
specified in the Dimension tab, it is recommended that you enable
Sparsity. You can then either select a datapoint to train on it,
or set dimensional filters in the Dimensions tab, as shown in the
following image.

The row count that
is displayed next to the Data Sparsity drop-down menu shows how many
rows will be generated using the current filters. The total row
count is the Cartesian cross-product of all the dimensions currently
filtered. If there are no filters specified, the entire cross-product
is used.
To specify filters, select any of the PMF dimensions
and use the Select FIlter drop-down menu
to select values, as shown in the following image.
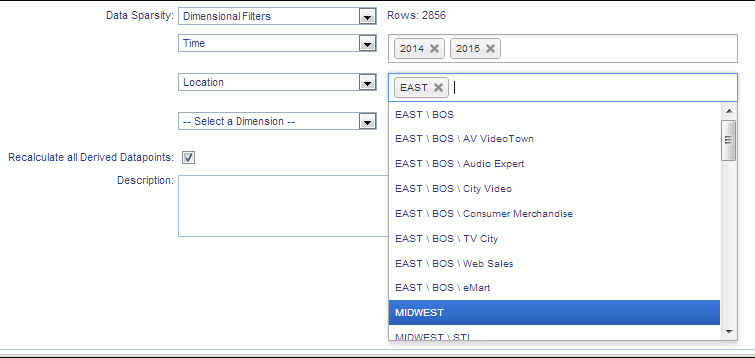
You can select as
many values as desired, one at a time. Once you have set your filters, you
can generate data. PMF will only generate data for the datapoints
along the filtered paths specified.
Note: When generating
data for a generated source, PMF will wipe all existing data before
regenerating it using your new rules. With generated sources, the
Preview tab is of value for new data you are planning to generate
into an empty source, or when changing rules. If your rules have
not changed, and data is showing up in the Preview tab as 100% added
and deleted, you do not need to generate data.
x
Reference: Previewing Generated Data
You
can preview the data that PMF will generate by clicking the Preview tab,
as shown in the following image.
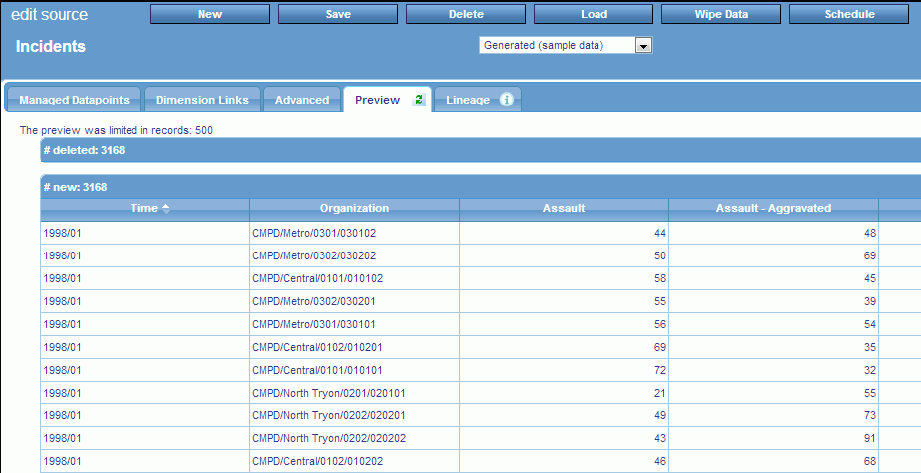
The
Preview tab generally shows rows that are new, or will be updated
or deleted.
Tips:
- The Preview tab shows
data to be handled before any operations occur. It divides this
data up into the following sections, based on what will happen to
the rows that are displayed:
- New rows to be created by generation.
- Rows to be updated by generation.
- Rows to be deleted by generation (depending on the Wipe Data
setting on the Advanced tab).
- Rows that will be kept, but whose values do not match the new
data to be generated (depending on the Wipe Data setting on the
Advanced tab).
- Opening the Preview tab will force the navigation bar to close,
in order to use as much screen width as possible. You can reopen
it by clicking the expand button at the top of the navigation bar.
- You can resort the preview contents in any order by clicking
the column headings. Note that the Preview will show data based
on the display limit set in the Load settings. To change this value,
see Load Settings.


