In this section: |
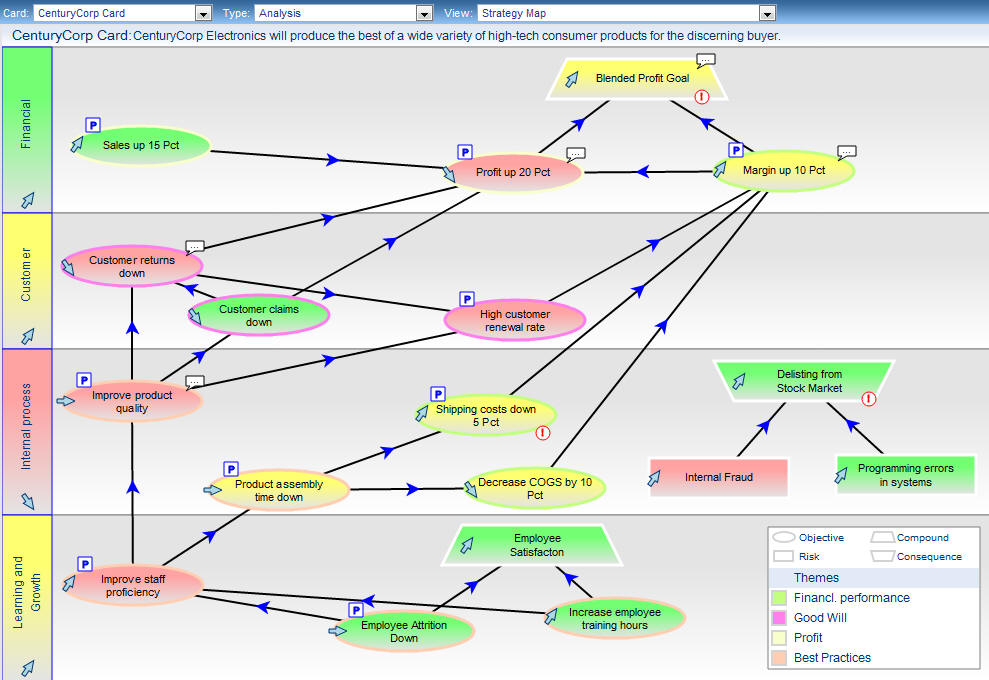
A Strategy Map is a graphical representation of the objectives used in your strategy. It shows the cause and effect linkages between leading and lagging objectives, and places the objectives within the perspectives that are significant for your enterprise.
The PMF read-only Strategy Map displays indicators that show the performance of metrics linked to the objectives displayed. The layout of the Strategy Map shows the relationship between objectives for your operational area of the enterprise. The indicators show an aggregate overall performance of the metrics you own for each of your objectives. The links between objectives for your enterprise represent the strategy of your enterprise.
With the Strategy Map, you can view objective properties, drill down to underlying measures, drill out to operational views, and access the cascade of scorecards using intuitive links and menus.
To display the Strategy Map, select Analysis from the Type drop-down menu on the Analytics tab, then select Strategy Map from the View drop-down menu, and click Run.
Note: When you run PMF in Internet Explorer, you can use the Renesis or the SVG Map plug-ins as a way to increase the flexibility of PMF.
The following is an example of a PMF read-only Strategy Map.
Right-clicking an Objective on the Strategy Map displays additional options, as shown in the following image.
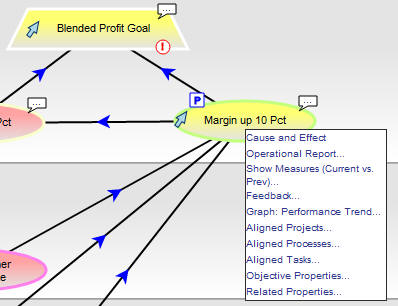
These options include:
For consumers and analysts, the Strategy Map is read-only. For authors, the Strategy Map can be read/write if it has been configured that way by the administrator. For more information about working with the Strategy Map as an author, see Performance Management Framework Author.
If you have created Themes for a Scorecard, the Strategy Map in PMF displays a legend that lists the Themes and indicates by color, which themes have been assigned.
Note: Themes are represented using a color halo around linked Objectives.
In the read/write Strategy map on the Strategy tab, you can drag and place the Theme legend anywhere you want on the surface of the Strategy Map. When you click Save, the position for the Themes legend is stored.
The Themes legend appears in:
Cause and effect drills are now available in the Strategy Map. Clicking on any Objective, Compound, Risk, or Consequence on the Strategy Map shows the immediate causes and effects.
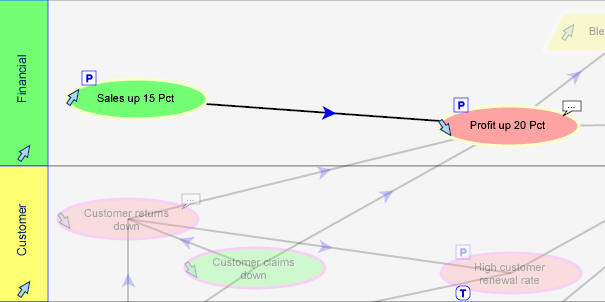
Note: You can also see these drills by right-clicking any Objective, Compound, Risk, or Consequence and selecting Cause and Effect.
| WebFOCUS |