System Tab
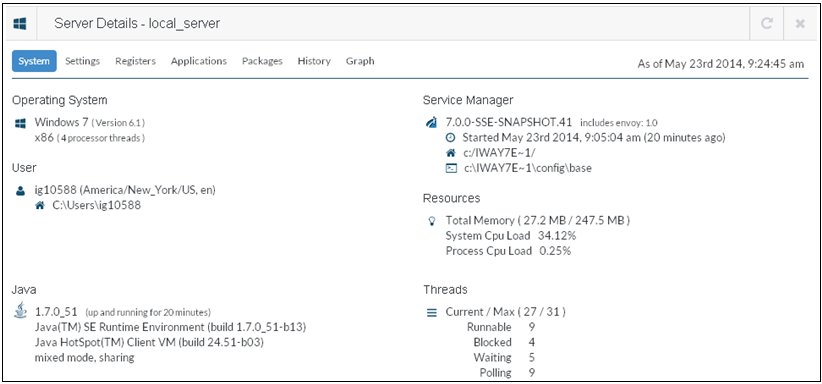
The System tab provides overall information about the server, its location and resource utilization, as shown in the following image.
In this section: |
As part of server monitoring, you have access to an array of statistics and information about overall server behavior, as well as ability to modify the runtime environment of the server directly.
To access information about a server, select the specific server from the available list of servers. The information will be displayed on the bottom of the screen.
The System tab provides overall information about the server, its location and resource utilization, as shown in the following image.
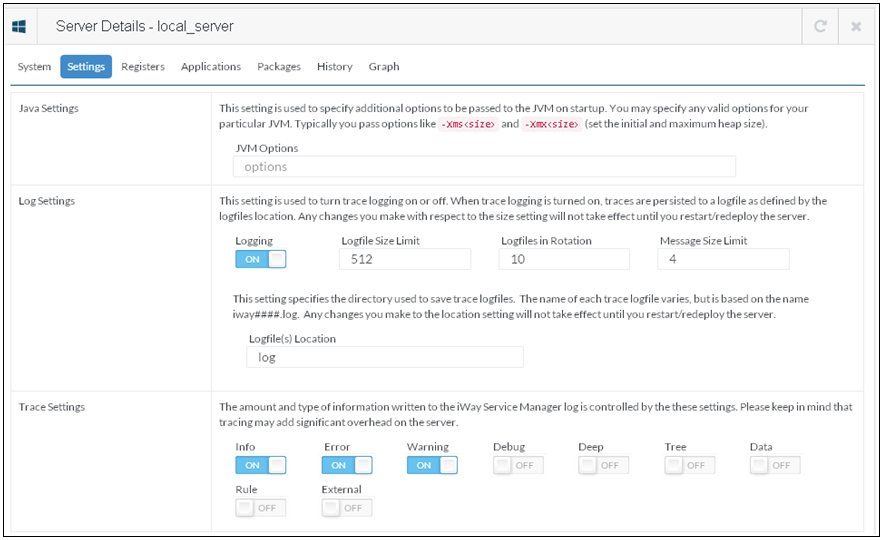
The Settings tab enables the tuning of the server. This settings can be changed and will take affect directly on the server, as shown in the following image.
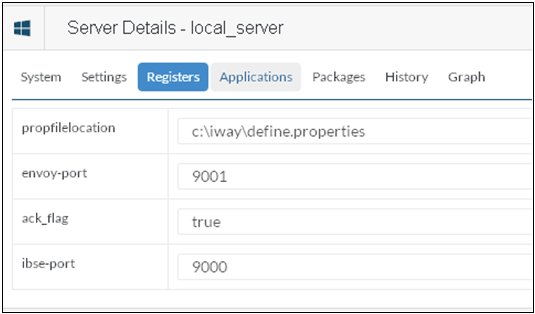
The Registers tab enables the update of the server-level registers configured on the server, as shown in the following image.
The Applications tab provides a summary view of the iWay Integration Applications running on the server, as shown in the following image.
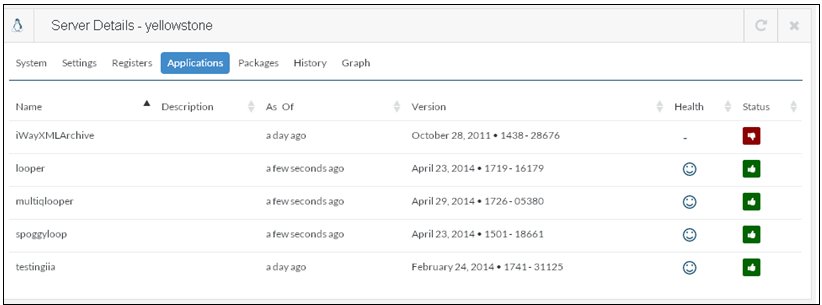
For more information on managing and monitoring applications, see Managing and Monitoring Applications. Clicking on the application will take you to the detailed view of the application.
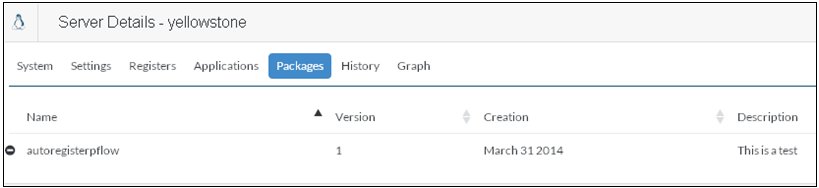
The Packages tab provides information on the currently available packages on the server, as shown in the following image.
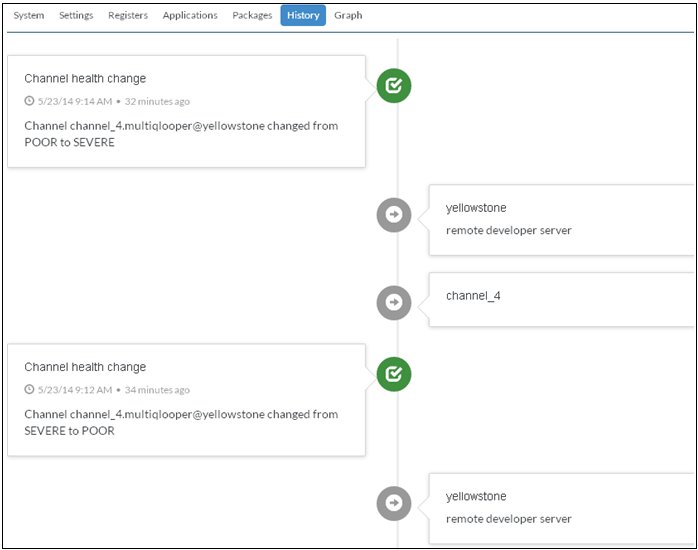
The History tab provides a historic view of the actions performed on the server and behavioral changes. These includes changes on the server itself, such as addition of a new application or a channel, as well as changes on the Sentinel side which would include things like change in the server health determination and overall status.
The Graph tab provides a graphical representation of the components of a server as they relate to each other. You can hover over a specific node to see its information, as well as move the graph around to change its display.
The graph is centered around the orange node indicating a server which is being presented, with light-blue nodes representing the applications connected to this server, and then the blue nodes representing the channels associated with each application running on this server.
| iWay Software |