In this section: |
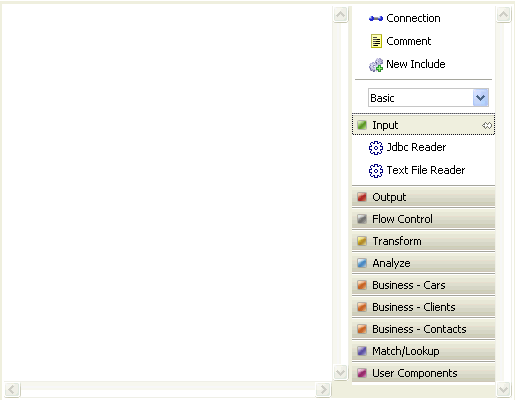
The Plan Editor consists of a canvas, where the transformation process logic is defined by connecting steps together, and a palette, where the various steps are listed, as shown in the following image.

You can add steps to the Plan Editor by dragging a step from the palette and dropping it onto the canvas, as shown below.
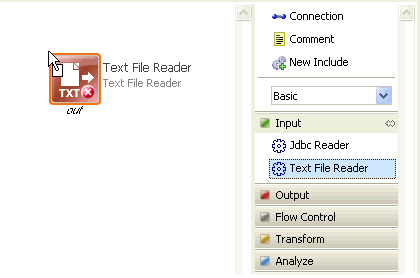
The steps can be connected together by dragging the out endpoint of one step to the in endpoint of another, as shown in the following image.
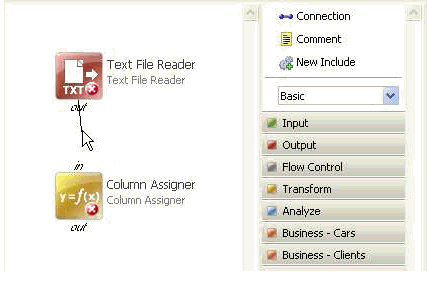
You can also select the Connection object from the palette and then click the output from one step and then the input from another step, as shown below.
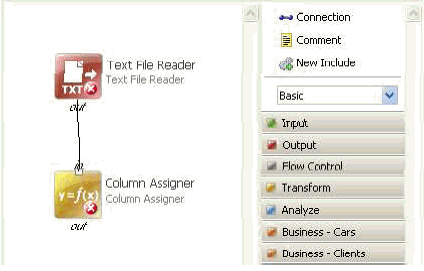
The connection adjusts itself into place when the cursor gets near, as shown in the following image.
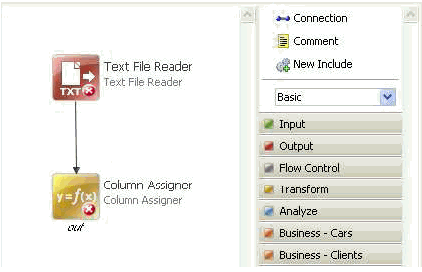
Properties for each step can be edited by double-clicking on the step, or by right-clicking the step and selecting Edit Properties, as shown in the following image.
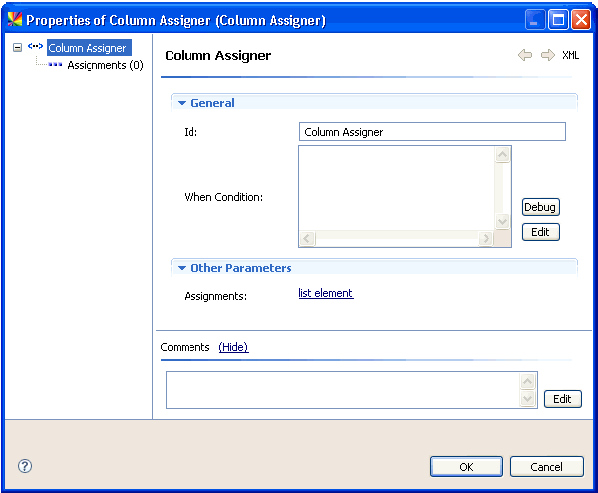
For information on the available steps in MDS Manager and their functions, see the documentation files for each step, located in the Help menu.
By default, the palette is set to show only the most frequently-used steps. The set of steps available in the palette can be modified by using the palette set selection list in the palette.
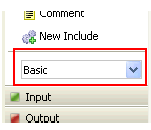
The following list shows the palette set options.
Palette sets can be added and modified in the preferences by clicking Window, selecting Preferences, MDS, Plan Editor, and then clicking Palette Sets.
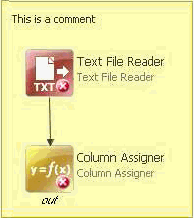
Comments can be used to place notes or other information on the canvas, or to place around a series of steps to visually group them together.
Plans can be embedded inside other plans in order to reuse a series of steps that have already been created or simply to save space on the Plan Editor canvas. This is done by dragging the New Include object from the palette onto the canvas and selecting the plan file to include.
To connect the included plan to other steps in the plan, right-click on the included plan and select Add step reference. Select the appropriate input and/or output steps from the displayed list of steps in the embedded plan.
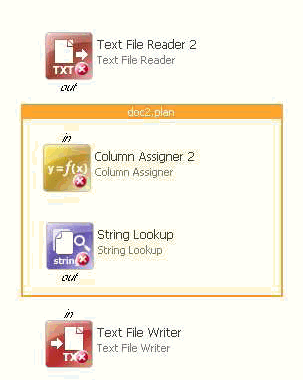
To use the embedded plan, connect the steps inside the included plan to the steps in the containing plan file, as shown in the following image.
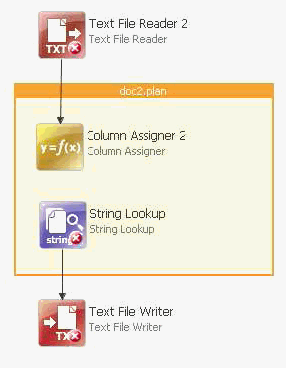
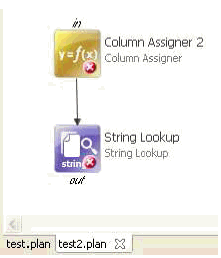
Double-clicking the include box opens the included plan for editing. The tabs show the included plans. To return to the containing plan, use the tabs at the bottom of the canvas, as shown in the following image.
Existing files can be added to the MDS Manager for use as input data. Files can be added by dragging them from the file system and dropping them to the Files folder in the navigation panel, or by copying them from the destination folder to the desired folder inside the workspace folder in the file system.
To use an input file in a plan, it must first be assigned metadata describing the format of the data. When a data file (for example, a .txt or .csv) is opened for the first time, the metadata editor is launched, as shown in the following image.
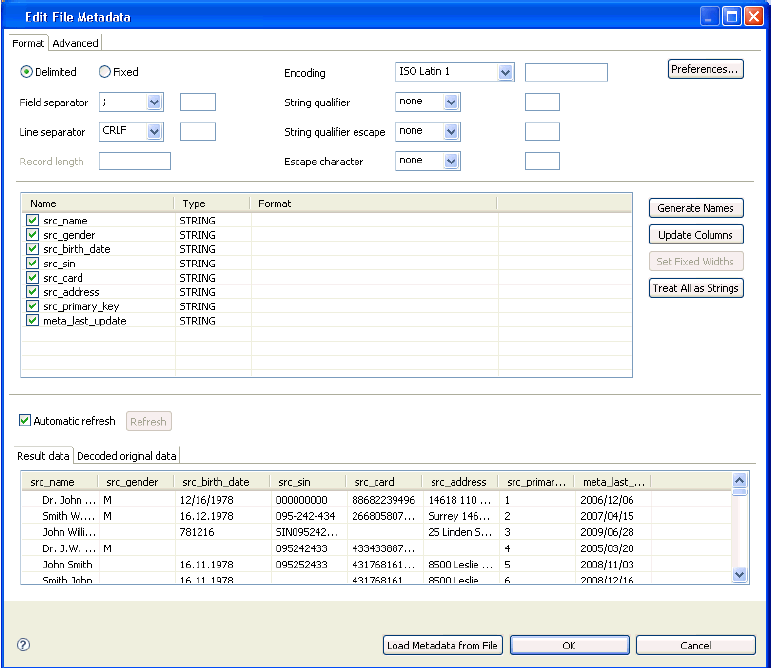
The metadata editor presents options for how to read the file, such as the type of delimiter used, the data types of each column, and whether the file contains header rows. The result data can be previewed in the lower panel of the editor to examine the results of the metadata settings. Clicking OK in the metadata editor opens the data file for viewing.
The file metadata can be edited at a later time by right-clicking on the file and selecting Edit Metadata.
Double-clicking a text file (for example, a .txt or .csv), opens it for viewing in the CSV Viewer. The CSV Viewer displays the data in rows and columns, as defined in the file metadata.
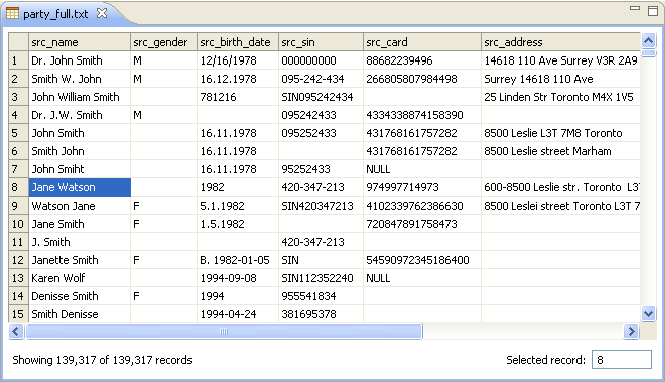
To sort a column, click the name of the column in the header row. Clicking once will sort the data in ascending order (for example, smallest-to-largest, or A-to-Z), indicated by an up arrow. Clicking again will sort the data in descending order, indicated by a down arrow. Clicking a third time will remove all sorting and revert to the original ordering of the data, indicated by no arrow.
To show only a subset of the data, click the View Settings button in the toolbar.
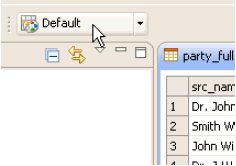
The View Settings dialog appears, which contains the Filter, as shown in the following image.
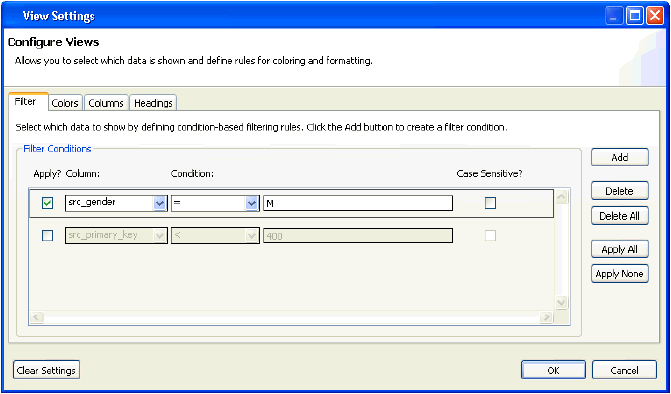
To define a filter, click the Add button. Use the drop-down list to select a column to filter and a condition to apply (for example, =, <, contains). Then specify the matching criteria. It is also possible to specify whether the filter should be case sensitive or not. This will display only rows matching the filter criteria. Multiple filters can be defined to further refine the data that is shown.
To remove a filter without deleting it, uncheck the Apply checkbox.
By default, all data is shown in black text on a white background using the default font settings. However, rules can be configured so that certain data values or ranges are colored or formatted differently. This can be useful for visually scanning for key values in a large data file. The conditions are defined similarly to filters, but there are additional options for coloring and text formatting (available using the Coloring button).
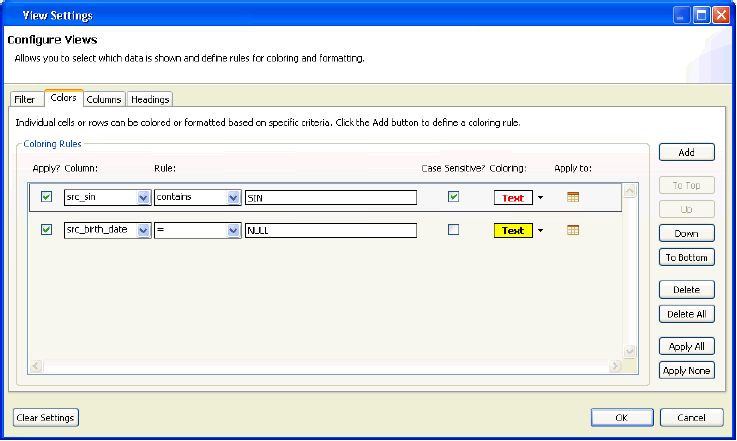
Additionally, you can also define whether the coloring rule should be applied only to the specific cell which matches the coloring rule or to all (or any subset) of the columns.
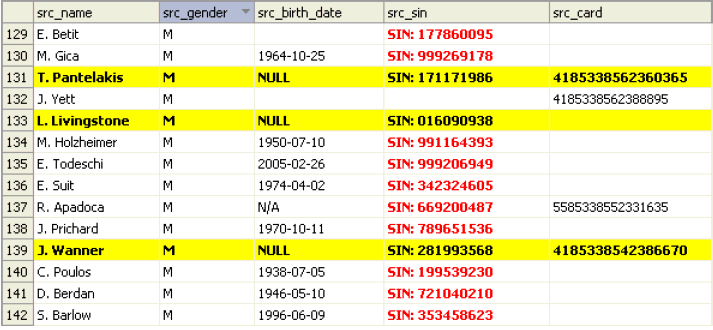
Coloring rules are applied in the order in which they appear. The order can be changed using the buttons on the right, below the Add button.
For data files with many columns, it is useful to hide certain columns to focus on specific data. This can be done in the Columns tab of the View Settings dialog. Uncheck a column to hide it from view. When columns are hidden, a note appears at the bottom of the CSV Viewer indicating the number of columns that are hidden and providing a quick link to show them all.
A column can also be hidden by right-clicking on it and selecting Hide Column.
Many data files use standardized naming conventions to group similar columns. The View Settings dialog allows you to specify different colors for column headers based on all or part of the column name. In the Heading tab, a column mask can be defined (for example, src*), which will color all headings whose name starts with the text specified. A different background color can be specified for each mask that is used.
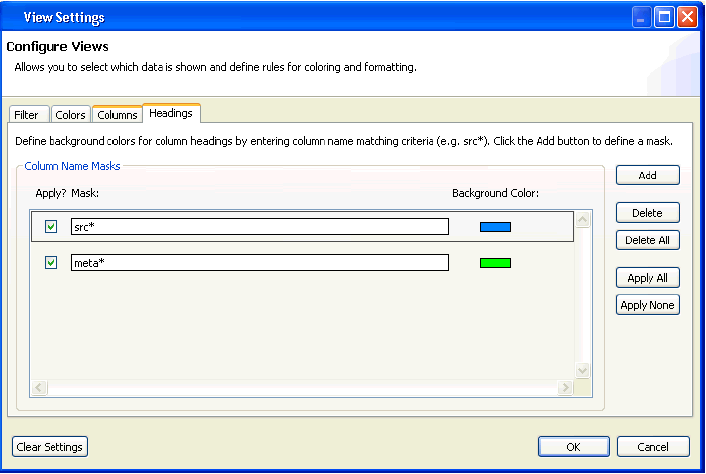
The following image shows the resulting column header.

Column widths can be resized by placing the cursor in the column header and dragging the column divider left or right. Columns can be automatically sized to fit their contents by double-clicking the column divider.
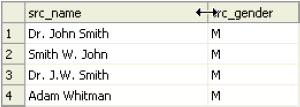
Additionally, right-clicking on a column header brings up a menu which offers, among other functions, the ability to autofit the selected column or all columns.
Also available in the column header context menu is the ability to visually mark changes in data. This can be useful, for example, to visually scan a specific column to look for changes in the data.
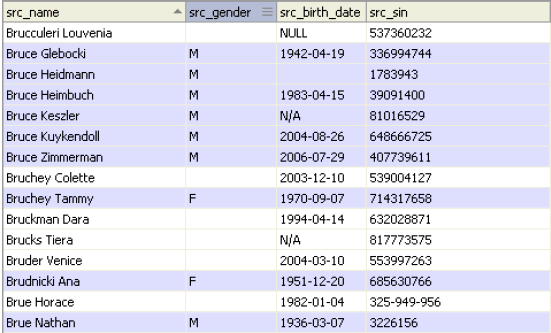
The column whose groups are marked, is indicated by an icon showing three parallel horizontal lines next to the column name.
To preserve the view settings (including sorting, column widths, and marked groups) for later use, use the View Settings drop-down list to open the options menu.
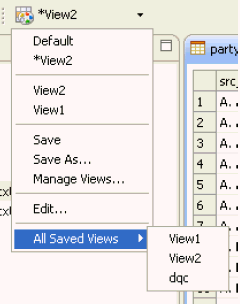
Click the Save As button (for creating a new saved view) or Save button (for saving changes to an existing view) options to store view settings. A list of recently used views will be shown at the top of the menu. A complete list of all saved views is shown in a submenu at the bottom, labeled All Saved Views. An asterisk (*) next to the view name indicates that unsaved changes have been made to the current view.
To delete a view, select the Manage Views option. It is also possible to import and export views for use with other copies of the product using this menu option.
The Default option is a stored view with no settings applied. It cannot be changed or deleted. When changes have been made to the default view, the toolbar button label changes to <custom>, which indicates an unsaved view based on the default view. Click the Save As option to name and store the new view. The Edit option is the same as clicking the toolbar button, which opens the View Settings dialog.
DQC offers a large number of steps and functions for constructing plan files. The algorithms and logic used to create a plan file will vary from project to project; an introduction to steps and functions is provided below.
Steps can perform many types of functions, such as transforming data, filtering and categorizing data, and reading and writing data. The following tables are overviews of some of the most-frequently used steps and their functions.
Flow Control Steps
The following table is an overview of the Flow Control steps.
|
Icon |
Step Name |
Step Description |
|---|---|---|
|
|
Condition |
This step directs data flow. If set to true, data flows to the right. If set to false, data flows to the left. |
|
|
Filter |
This step directs data flow. If set to true, data flows out. |
|
|
Extract filter |
This step directs data flow. If true, data flows to the right. If all, data flows to the left. |
|
|
Multiplicator |
This step multiplies data flow without modifications. |
|
|
Trash |
This step discards the data flow. |
|
|
Join |
This step is similar to the SQL table join. |
|
|
Union |
This step is similar to the SQL table union. |
|
|
Union same |
This step is similar to union, but applies only if the flows are exactly same. |
|
|
After format |
This step allows you to add or remove columns. |
Data Parsing Steps
The following table is an overview of the Data Parsing steps.
|
Icon |
Step Name |
Step Description |
|---|---|---|
|
|
Regex Matching |
This step parses the input string based upon regular expression capturing groups. |
|
|
Pattern Parser |
This step parses the input text based upon patterns provided. You must define all components and optional validations against dictionaries. |
|
|
GuessNameSurname |
This step is a predefined version of Generic Parser used for the parsing of names. |
|
|
Strip Titles |
This step extracts strings found in the dictionary from the input. For example, James White PhD becomes James White, PhD. |
|
|
Apply Replacements |
This step replaces values found in the input with their standardized value. This step replaces even substrings, for example, 5th Ave to 5th Avenue. |
|
|
Lookup |
This step is a lookup and validation against dictionary. |
Analysis Steps
The following table is an overview of the analysis steps.
|
Icon |
Step Name |
Step Description |
|---|---|---|
|
|
Profiling |
This step is a comprehensive analysis written to a file (.profile). |
|
|
Character Group Analyzer |
This step calculates masks (for example, digit -># letter -> A) |
|
|
Word Analyzer |
This step substitutes words found in reference dictionaries by symbols. |
|
|
Relational Analysis |
This step calculates the number of missing foreign keys for both source flows. |
|
|
Data Quality Indicator |
This step calculates statistics for a given set of business rules. It also adds a set of boolean flags to each record. |
Match and Merge Steps
The following table is an overview of the match and merge steps.
|
Icon |
Step Name |
Step Description |
|---|---|---|
|
|
Unification |
This step assigns IDs to groups (clients, candidates, unification roles) and is able to do the incremental process using the repository. |
|
|
Representative Creator |
This step creates new records from the defined group (records that already have a group ID) and is also able to add calculated values into the original data flow. |
|
|
Simple Group Classifier |
This step calculates the quality of groups The following list shows the quality types.
|
|
|
Unification extended |
This step is able to run the match process in mixed mode: online and batch in parallel. |
There are many functions available in DQC that can be used inside steps. Some of the common functions are listed in the table below.
|
Function |
Description |
Return Value(s) |
|---|---|---|
|
matches |
Full match. This function matches input data with a regular expression. |
True/false |
|
find |
Partial match. This function is a regular expression in input string. |
True/false |
|
substr |
This functions gets the substring of the input string, starting with zero. |
string |
DQC supports the use of regular expressions for pattern matching. Some of the basic regular expressions are listed in the following table.
|
Regular Expression |
Matches |
|---|---|
|
\d |
Number |
|
[A-Z] |
Uppercase letter |
|
[a-z] |
Lowercase letter |
|
\s |
Whitespace |
|
.(dot) |
Any character. |
|
? |
Once or none. |
|
+ |
Once or none. |
|
* |
Zero or more times. |
|
{2,6} |
At least 2 times, maximum 6 times. |
|
^ |
Beginning of string. |
|
$ |
End of string. |
The following table is an example of two regular expressions and their uses.
|
Regular Expression String |
Sample Usage |
|---|---|
|
[A-Z] [0-9] [A-Z]\s?[0-9] [A-Z][0-9] |
Canadian ZIP code (e.g., A3A 9S9) |
|
(\d{3} \d{2} \d{4}|\d{9}|\d{3}\-\d{2}\-\d{4}) |
US Social Security Number (123 45 789 or 123456789 or 123-45-6789) |
| iWay Software |