
In this section: |
The Activity Management tab allows you to monitor activities at the iWay Service Manager channel level. In the iWay Business Activity Monitor console, four tabs are provided in the Activity Management facility for configuration purposes:
The following image shows the top pane of the iWay Business Activity Monitor console, where the main tabs are located.

BAM provides several levels of monitoring. The three major types of monitor categories are:
Channel Level Monitoring provides a view into the transaction life cycle as it passes through a single channel with a unique Transaction ID. The message is tracked within a single channel with a single Transaction ID. This functionality enables backward compatibility with prior 6.0.1 releases of BAM. It is still useful in isolated implementations where the transaction life cycle is of interest only within a single channel and not across multiple channels. This is true for monitoring EDI-based transactions where the entire transaction is processed by a single channel or for transactions which carry single partner information for each channel and can be monitored through Partner Activity.
Transaction Level Monitoring provides an enhanced view into the transaction life cycle as it passes through multiple channels or multiple servers. This is the recommended method of monitoring transactions for most applications. It is important to note that with this enhanced functionality, there is the additional application responsibility to incorporate Transaction ID management into its process. For example, if you have multiple channels through which a transaction is propagated and they are linked by an internal iWay component such as Internal Queue mechanism, there is no additional work that needs to be performed by an application. The Transaction ID will remain the same through the message life cycle even as it is processed by multiple internal channels. However, if the link between a multi-channel architecture is externalized, it is the responsibility of the application to incorporate Marshaling services to manage and propagate the message across multiple channels or even servers maintaining its Transaction ID. This provides a unified view into its entire message life cycle united by a single Transaction ID. For more information about Marshaling services, see the iWay Service Manager Component Reference Guide.
Correlated Transaction Monitoring uses correlation services to link long-running transactions with different Transaction IDs into a single view. An example would be an invoice that is sent for processing, which can take several hours. In this case, the sending of the invoice, which has a unique Transaction ID will be linked with Payment processing, which also has its own Transaction ID through a unified and propagated Correlation ID. This implementation is most applicable when used as an addition to Transaction level monitoring. For more information about correlation services, see the iWay Service Manager Component Reference Guide.
The following sections provide more information on each available tab in the Activity Management facility.
Prior releases of the iWay Business Activity Monitor console relied on a channel-based view of the environment. This allowed operational people to monitor channels and deal with issues from a channel perspective.
However, it has been determined that a transaction-based view has greater business and operational benefits. The transaction screen allows users to watch a transaction through its life within the iWay service bus.
Note that the Transaction History and Message views found in the Transaction Activity tab are the same as in the Channel Activity tab.
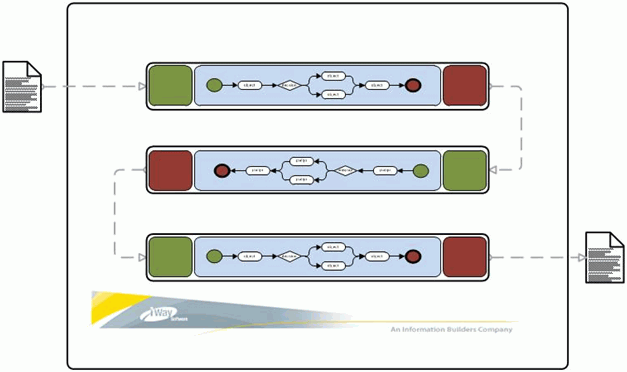
Most implementations involve transactions spanning multiple channels. Tracking this activity from a channel perspective forces the user to have to understand the application infrastructure (for example, what channels relate to each other and why). The transaction channel removes the need to understand the application architecture and allows users to logically follow the life cycle of the transaction in realtime.
The following image shows an architecture that uses three channels to process a transaction.
The Channel Activity view gives you a view of channel activity, as show in the image below.
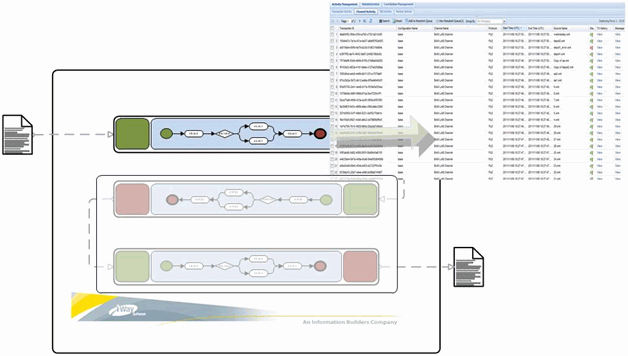
The iWay Business Activity Monitor console provides the option to define which channel to view.

The transaction view allows transactions to be monitored as they pass through multiple channels, as shown in the following image.
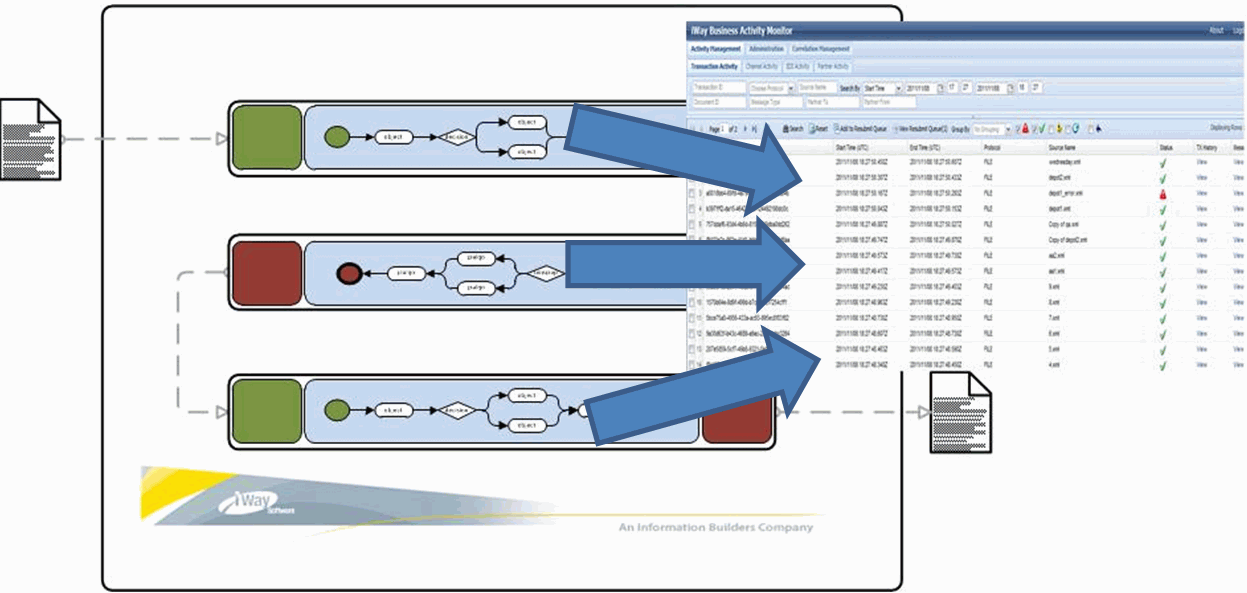
The transaction view provides a quick way to see the overall situation. This allows you to easily diagnose a problem and trace it back to the source of the problem.
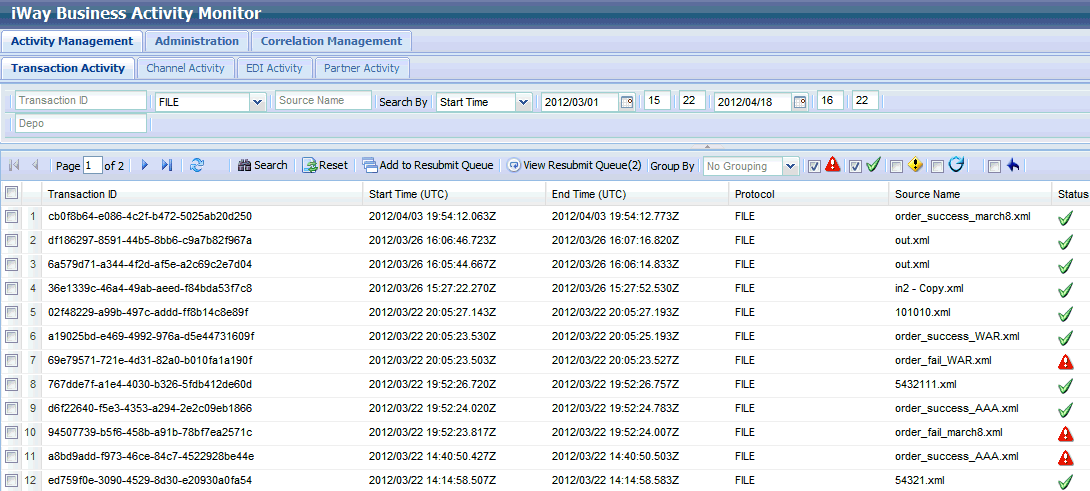
The following table lists and describes all of the columns that are available in the Channel Activity tab of the Activity Management facility.
|
Column Name |
Description |
|---|---|
|
Transaction ID |
Unique ID that is automatically generated by the processing channel. |
|
Start Time (UTC) |
Start time (shown in GMT) at which BAM logged the start time of the message. |
|
End Time (UTC) |
End time (shown in GMT) at which BAM logged the end time of the message. |
|
Protocol |
Protocol on which transactions have been received and processed. |
|
Source Name |
Name of the transaction, depending on the protocol. For example, File-based and FTP-based protocols generate the name of the file read. Queuing (MQ) protocol generates the name based on the header values. This value can also be set using the bam_sourcename register. |
|
Status |
The overall transaction status, that is shown as a flag.
|
|
TX History |
Shows the transaction history and transaction path of the given transaction. |
|
Message |
Hyperlink opens the message with which the transaction was started. |
You can also customize the view and select or deselect any column for viewing. Some of the additional non-default columns are shown in the following table.
|
Column Name |
Description |
|---|---|
|
Duration |
Total time it took to complete the execution process. |
|
Resubmit Count |
Count of the number of times that the transaction has been resubmitted. |
|
Record Key |
Internal reference for this specific record in the BAM table. This is used for debugging or specific data retrieval purposes. |
Note: Any user-defined register columns can also be added.
To view a detailed transaction history of the event message, click the View hyperlink under the TX History column, as shown in the following image.

The information displayed by the TX History view depends on the BAM options that are configured.
Note: The application design process determines the account performance requirements and detailed view requirements. For example, increased logging that is performed for each transaction will result in a loss of performance. It is recommended to disable the Want Events option to maximize performance and to utilize specialized Log Message services to log transaction check points at needed locations. For more information about Log Message services, see the iWay Service Manager Component Reference Guide.
An example of the Transaction History view is shown in the following image.
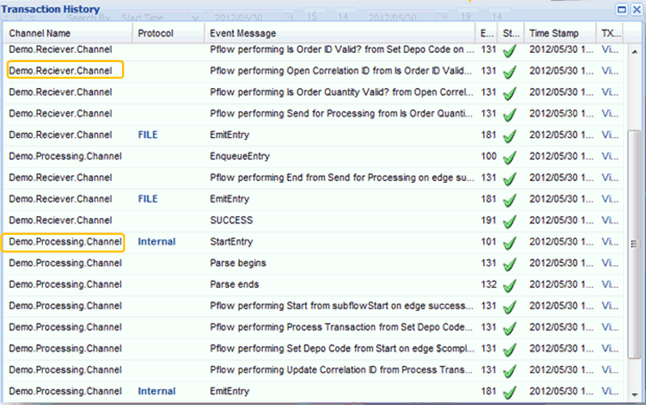
Notice that the transaction has maintained its transaction ID and was executed by multiple channels. It was first received by Demo.Receiver.Channel and then sent for processing to Demo.Processing.Channel. This is one of the key features, which enables a single view into the transaction life cycle as it spans across multiple channels or even servers as long as it maintains its transaction ID.
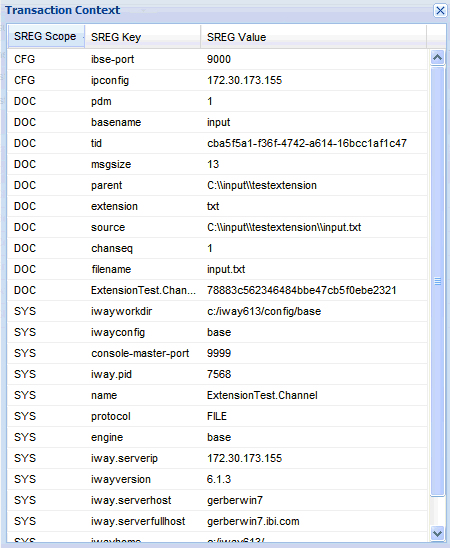
For a more detailed perspective, clicking View under the TX Context column enables the view of the transaction contexts (SREGs) at a given step of the process. This view enables the user to identify what has happened to the transaction and view the attributes.
The Channel Activity tab is used to display activities that are occurring within a channel. It provides the channel name, when the activity happened, and when the activity ended, Status information (completed, failed, active) is also provided. Users also can view the specific message with which the transaction was executed and the transaction history of that particular transaction. In a multi-channel environment where a single transaction passes through multiple channels, an entry line for each channel executed for the given transaction will appear in the Channel Activity. Each entry line contains its own Transaction ID auto-generated by the processing channel. To track transactions across multiple channels or iSM servers/configurations, it is recommended to use the Correlation view for long running transactions or the Transaction Activity view for short running transactions in which case the same Transaction ID is preserved across multiple channels/servers through an internal mechanism or explicit marshaling of the message.
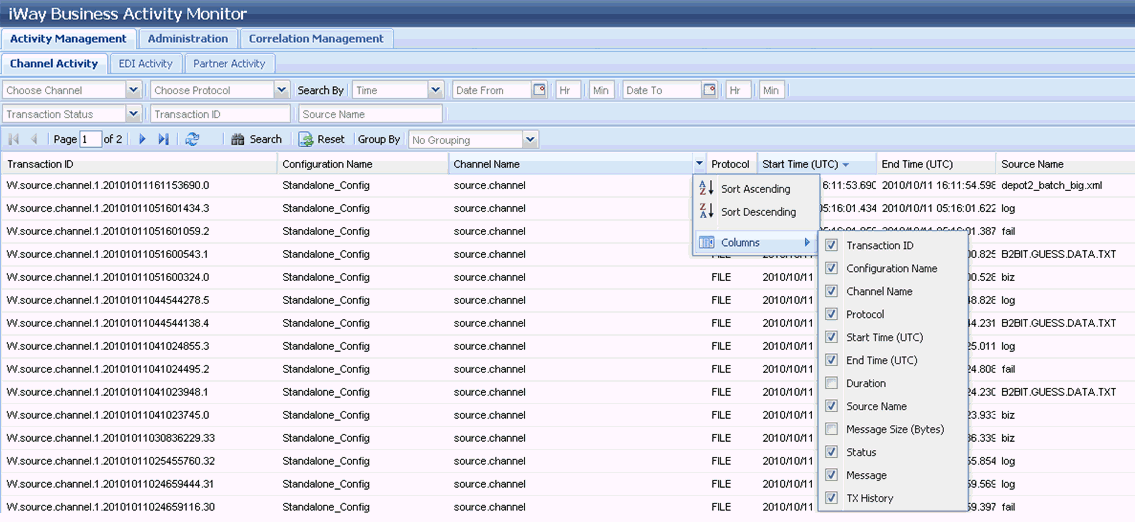
The following table lists and describes all the columns that are available in the Channel Activity tab of the Activity Management facility.
|
Column Name |
Description |
|---|---|
|
Transaction ID |
Unique ID that is auto-generated by the processing channel. |
|
Configuration Name |
Name of the configuration where the transaction has been processed. In multi-node deployment, it can be used to identify multiple client configurations. For more information, see Installing iWay Business Activity Monitor. |
|
Channel Name |
Name of the processing channel on which the message is being executed. |
|
Protocol |
Protocol on which transactions have been received and processed. |
|
Start Time (UTC) |
Start time is shown in GMT at which BAM logged the start time of the message. |
|
End Time (UTC) |
End time is shown in GMT at which BAM logged the end time of the message. |
|
Source Name |
Name of the transaction depending on the protocol. For example, File and FTP based protocols generate the name of the file read. Queuing (MQ) protocol generates the name based on the header values. This value can also be set using the bam_sourcename register. |
|
Status |
The overall transaction status that is shown as an icon.
|
|
TX History |
Shows the transaction history and transaction path of the given transaction. |
|
Message |
Hyperlink opens the message with which the transaction was started. |
You can also customize the view and select or deselect any column for viewing. Some of the additional non-default columns are shown in the following table.
|
Column Name |
Description |
|---|---|
|
Duration |
Total time it took to complete the execution process. |
|
Message Size |
Size of the processed execution. |
|
Resubmit Key |
Internal reference key for the record that has been resubmitted. |
Note: Any user-defined register columns can also be added.
To view the input message received by the channel for processing, click the View hyperlink under the Message column, as shown in the following image.

The Transaction Data dialog opens, as shown in the following image.
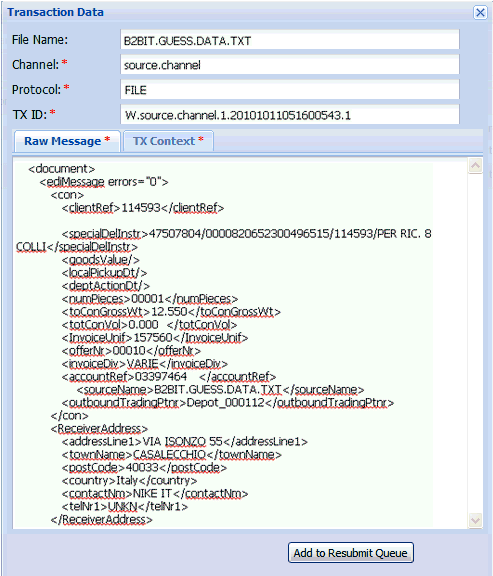
The following table lists and describes the available fields and tabs in the Transaction Data dialog.
|
Field/Tab |
Description |
|---|---|
|
File Name |
The name of the file received for processing (availability depends on protocol). |
|
Channel |
The associated channel for the message. |
|
Protocol |
The protocol on which the message is received. |
|
TX ID |
The Transaction ID for the message. |
|
Raw Message tab |
Displays the actual raw data of the message. |
|
TX Context tab |
Provides information regarding the Special Registers (SREGs) associated with the processed messages. Based on your permissions, all field values can be edited and resubmitted. For more information, see Message Resubmission. |
To view a detailed transaction history of the event message, click the View hyperlink under the TX History column, as shown in the following image.

The information displayed by the TX History view depends on the BAM options that are configured.
Note: The application design process determines the account performance requirements and detailed view requirements. For example, increased logging that is performed for each transaction will result in a loss of performance. It is recommended to disable the Want Events option to maximize performance and to utilize specialized Log Message services to log transaction check points at needed locations. For more information about Log Message services, see the iWay Service Manager Component Reference Guide.
In the example that is shown, all of the events are enabled to demonstrate a full cycle of the transaction.
The following image shows the steps and transactions that occurred in the process flow.
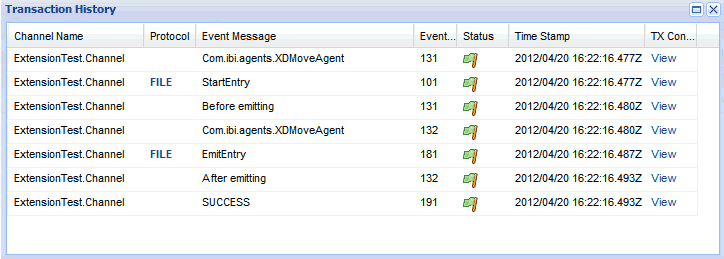
After the start node, the Source Name node has been executed, followed by the Decision Test node to test, followed by a call to IWFAIL indicating an error. It is up to the application to put as much detailed information into the node and its message to enable you to track the information and identify each step of the process. You can immediately see what step the transaction failed to process.
For a more detailed perspective, clicking View under the TX Context column enables the view of the transaction contexts (SREGs) at a given step of the process. This view enables the user to identify what has happened to the transaction and view the attributes.

The EDI Activity tab is used to display EDI activities. These activities are automatically identified based on the configured Ebix for the specific channel in the iWay Service Manager Administration Console. This view is populated only if there is a valid EDI-based channel running on the system. The transaction details are similar to channel activity and are based per transaction.
For EDI specific transactions, there are two types of statuses: an overall transaction status as it is processed, and an acknowledgment status indicating the state of the acknowledgment for the transaction. Note that the transaction can be successfully processed even though there are warnings or errors in the acknowledgment document. Properly handled errors in the application channel generates a successful state for the transaction as the execution has been able to complete all the steps in the application.

The following table lists and describes all the columns that are available in the EDI Activity tab of the Activity Management facility.
|
Column Name |
Description |
|---|---|
|
EDI Type |
Displays the type of EDI document that is received (for example, X12). |
|
EDI Version |
Displays the version of the EDI document that is received (for example, 4010). |
|
Ack Status |
The acknowledgment status is shown as a flag.
|
|
EDI Transaction ID |
Displays the EDI transaction ID of the EDI document that is received (for example, 850). |
|
Configuration Name |
Name of the BAM configuration that was provided during the Multinode mode configuration. For more information, see Installing iWay Business Activity Monitor. |
|
Channel Name |
Name of the channel on which the message is being executed. |
|
Start Time |
Start time is shown in GMT at which BAM logged the start time of the message. |
|
End Time |
End time is shown in GMT at which BAM logged the end time of the message. |
|
Status |
The overall message status is shown as a flag.
|
|
Message |
Hyperlink opens the message with which the transaction was started. |
|
TX History |
Shows the transaction history and transaction path and steps of the given transaction. |
The Partner Activity tab is used to display the activity that is occurring for partners. This is useful for business users to know how many transactions were executed for a particular partner. Activities are captured only if the bam_tpm_partnerid and bam_tpm_partnername Special Registers (SREGs) are set. If these SREGs are not set, then the Partner Activity tab will be empty. The values of these special registers are set in the process flow dealing with the transaction, either based on the information available from the incoming document or based on the Trading Partner Manager (TPM) look up. The Partner Activity enables you to group and organize transactions for any given partner and filter them based on various criteria.
Note: In the current release, the monitoring of partner information can also be achieved in the Transaction Activity tab by utilizing monitoring of the user-defined registers for partner information.
The following image shows the contents of the Partner Activity tab displayed in the iWay Business Activity Monitor console.
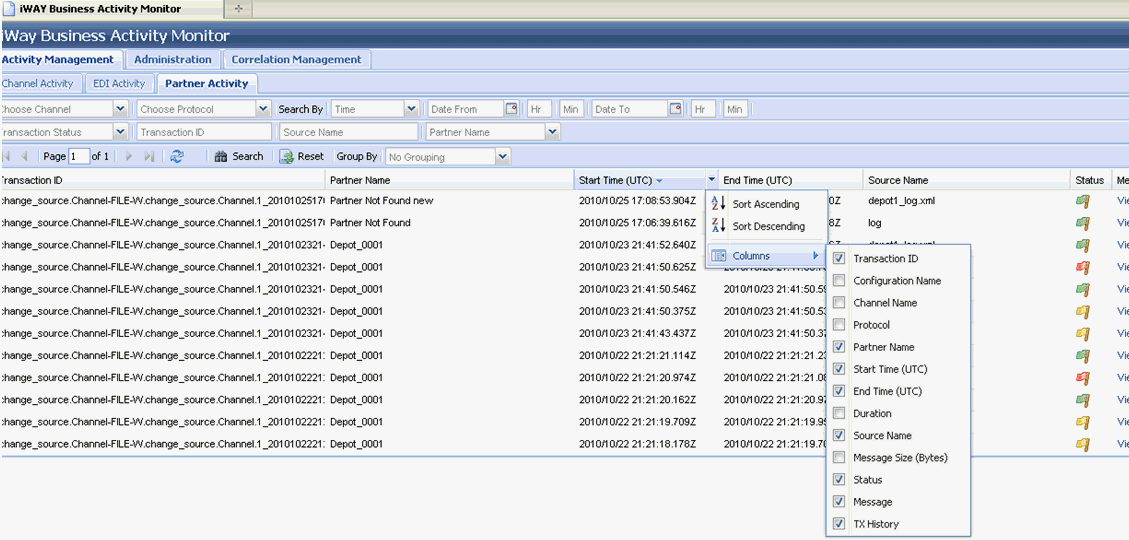
The following table lists and describes all the columns that are available in the Partner Activity tab of the Activity Management facility.
|
Column Name |
Description |
|---|---|
|
Transaction ID |
Unique ID auto-generated by the processing channel. |
|
Partner Name |
Represents the name of the partner for whom the transaction is being processed. |
|
Start Time (UTC) |
Start time is shown in GMT at which BAM logged the start time of the message. |
|
End Time (UTC) |
End time is shown in GMT at which BAM logged the end time of the message. |
|
Source Name |
Name of the transaction depending on the protocol. For example, File and FTP protocols generate the name of the file read. Queuing (MQ) protocol generates the name based on the header values. This value can also be set using the bam_sourcename register. |
|
Status |
The message status is shown as a flag.
|
|
Message |
Hyperlink opens the message with which the transaction was started. |
|
TX History |
Shows the transaction history and transaction path and steps of the given transaction. |
You can also customize the view and select or deselect any column for viewing. Some of the additional non-default columns are shown in the following table.
|
Column Name |
Description |
|---|---|
|
Duration |
Total time it took to complete the transaction. |
|
Message Size |
Size of the processed transaction. |
|
Configuration Name |
Name of the configuration where the transaction has been processed. In multi-node deployment, the name can be used to identify multiple client configurations. |
|
Channel Name |
Name of the processing channel. |
|
Protocol |
Protocol on which a transaction has been received and processed. |
To view the partner message, click the View hyperlink under the Message column, as shown in the following image.

The Transaction Data dialog opens, as shown in the following image.

The following table lists and describes the available fields and tabs in the Transaction Data dialog.
|
Field/Tab |
Description |
|---|---|
|
File Name |
The name of the file received for processing (availability depends on protocol). |
|
Channel |
The associated channel for the message. |
|
Protocol |
The protocol on which the message is received. |
|
TX ID |
The Transaction ID for the message. |
|
Raw Message tab |
Displays the actual raw data of the message. |
|
TX Context tab |
Provides information regarding the Special Registers (SREGs) associated with the processed messages. Based on your permissions, all field values can be edited and resubmitted. For more information, see Message Resubmission. |
Clicking the View hyperlink under the TX History column enables the detailed view of the transaction history. It displays every step logged for the executed transaction. This helps determine the possible reason for a transaction failure.
For example, in the following image, you can see the transaction steps of the process flow. After the start node, the Source Name node has been executed, followed by the Decision Test node to test, followed by a call to IWFAIL indicating an error. It is up to the application to put as much detailed information into the node and its message to enable you to track down the information and identify each step of the process. You can then see at what step the transaction failed to process.

For more information, click View under the TX Context column. This enables the view of the transaction contexts (SREGs) at a given step of the process. This view provides more details and enables you to identify what happened to the transaction and view the attributes.

Message resubmission allows a message to be retrieved for a particular transaction. It returns the message to be retrieved for a transaction with which it was run.
The View hyperlink under Message in the Activity Management section enables you to view the specific data of the message used for the transaction and resubmit the message either with changes or as is prior to resubmission. The View of the message provides default parameters, which you can modify to assist in the resubmitting.
Click View in the Message column for a corresponding transaction, as shown in the following image.

The Transaction Data dialog box opens, which shows the message that the selected transaction used to execute.

You can provide a file name to save the document and also change the document content as displayed. Click Resubmit Message once you are ready.
The document will be made available under the following directory:
iway_home\config\current_config\bam\resubmit\channel_name\file_name\TX_ID
where:
Is the directory where iWay Service Manager is installed.
Is the configuration where the server is running.
Is the channel name provided in the BAM Resubmit window. This enables you to resubmit the documents to a specified directory. The directory is auto-created if does not exist.
Is the file name provided in the BAM Resubmit window. This enables you to rename the file for resubmission or keep the default, which is the source name for the transaction.
TX ID provided in the BAM Resubmit window. This should be left as the default value as it enables you to look up further information from BAM database for the specific Transaction ID. However, the value can be changed to anything else as mentioned in the application requirements.
The document is now available (for example, to run in a process flow). Additional logic to use the document must be designed accordingly, but in most cases, the logic can involve moving the document from this directory to another.
Once the transaction is stored in the resubmit directory, the application will implement a resubmit channel to process the transaction. In most cases, the resubmit channel should validate that the transaction is allowed to be resubmitted and to which channel it should be routed to based on the transaction information.
Resubmitting a transaction is an application-supported service. iWay Business Activity Monitor (BAM) provides tools to assist in developing a resubmission facility, but does not, alone, affect a resubmission.
The main tools needed to develop a resubmission capability are:
Resubmission works most effectively with a multiple-channel architecture in which the application logic is separated from the initial acquisition of the message. In this case, the [repaired and] resubmitted message can be passed to the application logic at an appropriate stage of the execution.
Once a message is selected for resubmit, it needs to be written, by application logic, to an appropriate resubmit queue. From there, it might be passed to a repair station or simply set up for a later retry. Selection of a message is either by application logic (perhaps a communication failed or iWay Data Quality Center detected a rule violation in the original message) or manually in a form in which the message is selected and as a consequence written to the appropriate queue for resubmit handling.
A sample system is shown in the following image.
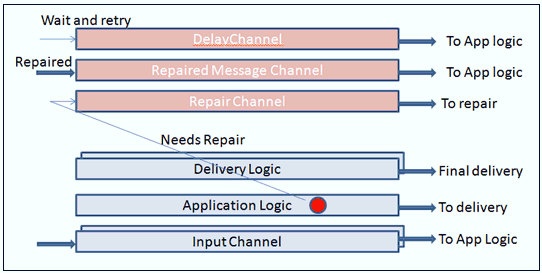
The application acquires the message through an input channel, which in the example elects to pass it on to the application logic. At some point(s) in the application logic, the message is tested. If the test passes, the message moves on, eventually passing to the delivery channel. If, however, the message fails the test (shown by the circle with the arrow) the message might be [depending on the test] written to the repair channel. Other errors might send it to a delay channel to simply await some triggering event. The scheduler facility can help with this. In our diagram, the repair channel sends the message to a repair station, where it is sent to a user to be modified, and from there the result arrives at the repaired message channel. From there, the message is passed back to the application logic.
The process of writing to the target repair or delay channel would encompass steps on the resubmit (failure) branch of the application logic flow, such as the following.
The Transaction ID will follow the message from channel to channel, enabling later analysis to associate the message with all of the steps (including the resubmission(s)) taken toward its final disposition.
The action on the repair channel itself or the delay is part of the application logic and is not a part of the resubmit facility.
A message can be resubmitted from various points of the process to provide extended flexibility to the application. Based on the user privileges, the message and its context (SREGs) can be modified for a resubmit process. Two types of resubmit options are available:
The message at hand resubmit option enables you to add the current message being viewed to the resubmit queue for processing. This type of resubmit takes the message with its context and adds it to the BAM resubmit table directly without any pre-processing. This would include adding a message from the Message or Transaction History views.
In the Message view, there is an option to add the selected message to the resubmit queue. This will add the original message to the resubmit queue.
Any Emit or Check point available in the Transaction History enables you to view the message under the Protocols column. The message can be added to the resubmit queue at any point, enabling you to add a partially processed message to the resubmit queue. This avoids duplicate work of the original application logic.
The selectable resubmit option enables you to add multiple messages to the resubmit queue at the same time. In this case, the transaction ID for each selected message is propagated to the pre-configured channel (BAM_TID_RESUBMIT_Channel), which, based on the configuration, selects the proper record to resubmit. The channel should be modified to meet your specific application requirements. By default, the original (101 event) message is added to the resubmit queue for the given transaction ID. For more information on the BAM_TID_RESUBMIT channel, see Configuring the BAM_TID_RESUBMIT_CHANNEL.
Mutli-message Resubmit
The Transaction Activity tab enables you to select multiple messages to be added to the resubmit queue by selecting multiple check boxes next to the messages. This will add the original message for each transaction to the resubmit queue.
BAM includes a pre-configured channel called BAM_TID_RESUBMIT_CHANNEL. This channel enables you to handle selective resubmits for multi-message resubmission. You must import, build, and deploy the channel to make it available to the application. If this channel is not available, then the resubmit facility will not work and will generate an error message indicating that the channel is not available.
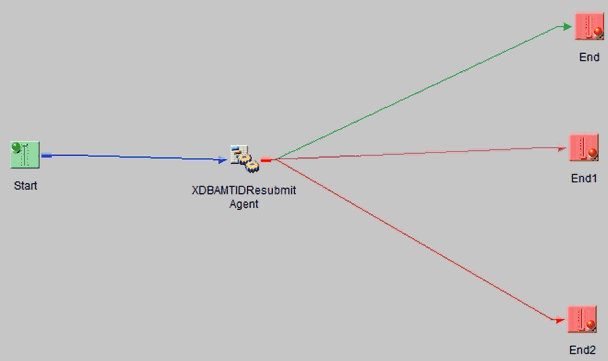
The BAM_TID_RESUBMIT_CHANNEL is based on an internal listener and has a corresponding process flow, as shown in the following image.
It is recommended that you modify this channel to meet your specific application requirements, as described in the following sections.
Using the BAM web console, when you select transactions and click Add to Resubmit Queue, the BAM logic creates an XML document for each selected transaction, which includes the following information about the selected transaction:
The generated XML document is written to an internal listener queue, called BAMTIDResubmit, which is hosted by the BAM_TID_RESUBMIT_CHANNEL. When a document for each selected transaction ID is created, the operation is considered complete and a message indicating Done is displayed in the console. If the internal queue name is not available for any reason, an error message is displayed in the console.
The user process flow associated with the internal queue channel receiving the resubmit record can analyze the input request in any necessary manner. As a final step in the process flow, it must call the service called BAMTIDResubmitAgent to enable the resubmit action. No output is expected or required from the user process flow. However, since the process flow operates under normal rules, it can take any additional channel action desired by the application designer.
The actual resubmit record key that has been determined by the process flow from the resubmit document is the data that will be resubmitted.
The process flow must handle the result edges from the service that are listed in the following table.
|
Edge |
Purpose |
|---|---|
|
success |
The request has been added to the resubmit release queue. |
|
fail_notfound |
The record key given to the service does not represent a record in the BAM database. |
|
fail_security |
The user does not have authority to submit this record. |
|
fail_operation |
The resubmit release queue could not be updated. |
The original terminal user will not see these errors, as the internal channel is operating asynchronously. Therefore, the process flow must handle the error, perhaps by sending an email or adding a message to a queue to be reviewed by the appropriate authority.
After the messages have been added to the resubmit queue, a user who has authorized credentials for the BAM web console can view, modify, and release resubmission from this queue.
When a message is resubmitted, it is written to the BAMResubmit internal queue. An internal listener should be configured by the user to process this queue. If this internal queue does not exist, then the message will be written under the default location configured in the Preference tab.
On entry to the process flow of the channel, the message and context is configured according to the resubmitted message. The process flow can then take any desired action based on your application requirements. Common actions include:
Search functionality is provided in all Activity Management facility tabs to filter the desired results.

Provide search criteria in the corresponding fields and click Search to display only the filtered records based on the search criteria. Click Reset to remove the selected search criteria and show all the records.
The following table lists and describes all the search fields that are available.
|
Field Name |
Description |
|---|---|
|
Choose Channel |
Allows data filtering based on a specific channel name. Channel data is displayed for which BAM has collected the data. |
|
Protocol |
Allows searching based on the protocol type that is used in the channel (for example, Internal, File, MQ Series). |
|
Search By |
Start and End time indicating the filtering which should be applied to the processed transactions based on time stamp initialization or completion, |
|
Time |
Time at which the message was first monitored on iWay Service Manager. |
|
Date From |
Date since the message was processed. |
|
Hr |
Hour from which the message starts to be monitored. |
|
Min |
Minutes from which the message starts to be monitored. |
|
Date To |
Date range up to which the message needs to be filtered. |
|
Hr |
Hour up to which the message needs to be filtered. |
|
Min |
Minute up to which the message needs to be filtered. |
|
Transaction Status |
Allows transaction search based on the transaction status of Success or Fail. |
|
Transaction ID |
Allows filtering based on the Transaction ID. |
|
Source Name |
Allows filtering based on the Source Name of the transaction. |
The Partner Activity Facility provides additional filtering capability to search by partner name, as shown in the following image.

The following table lists and describes the additional search field in the Partner Activity tab.
|
Field Name |
Description |
|---|---|
|
Partner Name |
Allows filtering based on the Partner Name for the transaction. |
| iWay Software |