Tracing is key to diagnosing problems and thus to application
reliability. iWay Service Manager provides a full complement of
tracing services, oriented to diagnostic analysis of the running
system. Tracing provides a step by step explanation of the activity of
the server internals.
Experience teaches that tracing can also be a major source of
performance degradation. The iWay console enables you to select
the levels of traces that you wish to generate and display. Unless
you are diagnosing a problem, you will usually want to limit the tracing
to error level only.
Traces are offered in several levels, controlled independently:
|
Trace
|
Description
|
|---|
|
BIZERROR
|
Shows error messages associated with processing
a document. Rule violations such as errors detected during analysis
of EDI documents are BIZERROR level.
|
|
DATA
|
Shows the incoming and outgoing documents
as they pass to and from the protocol channel.
|
|
DEBUG
|
Reports data that is helpful for debugging
situations. It shows logic that tracks the path of a document.
|
|
DEEP
|
Used for detailed logic tracing. Stack traces
are reported by the system in DEEP level. Usually you will use this
level only if instructed to do so by iWay support personnel.
|
|
ERROR
|
Shows error messages relating to operation
of the adapter. This level always displays.
|
|
EXTERNAL
|
External traces are disabled by default.
The server provides a route for third party tools that run under
control of the server (for example open source Apache code) that
uses java tracing to pass their traces through the server. Control
of the traces lies with the external code, for example Log4J. The
iSM server issues the traces when the external trace level is enabled.
Note: Unlike
other trace levels, masking the level does not affect the generation
of the trace line and the resources that the generation of the trace
consumes. Such control is managed by the Log4J or other control
mechanism.
|
|
INFO
|
Provides messages that the user always needs
to see to verify activity. The server puts out almost no messages
at INFO level.
|
|
TREE
|
Shows the document as it enters
and leaves the system in XML form. Intermediate processing as a
document evolves is done at TREE level.
|
|
WARN
|
Warnings are important messages that do
not denote an error, but should be reviewed.
|
All except INFO and ERROR levels can be masked off, so that the
log contains only brief informational and error messages.
Control of tracing is controlled in the Configuration System
Properties Diagnostics page of the console. It offers the ability
to set the log directory, manage the size of the log files, and
turn logging on and off. Unlike most design time settings, changing
trace levels takes immediate effect in the run time system. Changing
the log location does not take effect until the next restart of
the system.
x
Some components, both provided by iWay and your own,
may make use of third-party libraries that log with Log4J. In order
to capture these logs, iWay initializes the Log4J system as the
server starts. If the server finds a file named "log4j.properties"
in its current working directory, then it will try to configure
Log4J with this file. If no such file is found, then Log4J is configured
with the root logger at the INFO level and an appender that routes
Log4J messages to the log of the server.
For example, the NHTTP extension uses an HTTP client from Apache
Commons, which traces with Log4J. To view the wire header and context
messages for the HTTP client, you can use the following log4j.properties
file:
log4j.rootLogger=INFO, xd
log4j.appender.xd=com.ibi.logging.XDLog4jAppender
log4j.appender.xd.mapDebugToDeep=true
log4j.appender.xd.layout=org.apache.log4j.PatternLayout
log4j.appender.xd.layout.ConversionPattern=[%C{1} - %M()] - %m
log4j.logger.httpclient.wire.header=DEBUG
#log4j.logger.org.apache.commons.httpclient=DEBUG
In this example, rootLogger is set to the INFO level and then
XDLog4JAppender is added. The .xd on the definition
of the rootLogger is required. Since most applications that use
Log4J seem to handle the DEBUG level as the server does its DEEP
level, the mapDebugToDeep option on the appender writes Log4J DEBUG
messages to the DEEP level of the server. Finally, the appender
is set with a layout pattern that prints class, method, and message.
This mirrors the iWay format.
The last two lines control specific Log4J loggers created by
the HTTP client. For more information, refer to the documentation
for the relevant component.
Other components used within the server are configured individually
as appropriate for the component. For example, in OpenJPA you might
add the following line in order to trace JPA SQL calls:
log4j.category.openjpa.jdbc.SQL=DEBUG
For a general description for tracing OpenJPA, see the following
website:
http://openjpa.apache.org/builds/1.0.1/apache-openjpa-1.0.1/docs/manual/ref_guide_logging_log4j.html
Another example is the HTTP client (4) used by the nHTTP provider,
which can be traced. For more information, see the following website:
http://hc.apache.org/httpcomponents-client-4.3.x/logging.html
For example, header wire and context logging would add these
lines to the log4j property file.
log4j.logger.org.apache.http=DEBUG
log4j.logger.org.apache.http.wire=ERROR
As you add external information to the Log4J properties file,
add only the controlling entries.
Log4J is classed by iWay as an external log system, and is enabled
in the server by setting the external level. You can do this
by using the set command from the shell.
x
iWay Service Manager (iSM) offers a deferred tracing
mode. In this mode, most channel traces are deferred until an error
is detected in the channel. The traces associated with the message
are held, and if the message processing completes with no error,
the traces are eliminated. If an error trace is issued during the
processing of the message, then the held traces are emitted along
with all subsequent traces for the message. In either case, a trace
message at the debug level indicates the number of deferred traces.
Deferred trace messages are held in memory, and are formatted.
Therefore, use of deferred tracing does not significantly
affect performance and can result in increased memory use. Deferred
tracing is useful in situations where a message failure is rarely
detected. For example, 1 out of 100 messages raises an error. Using deferred
tracing can avoid the need for large trace files when only the failure
is being debugged. Deferred tracing at high trace levels (for example,
debug, deep debug, and so on) is not recommended for normal production
runtime. In these cases, only low trace levels (for example, info,
error, and warn) are usually enabled, as recommended for general
server use.
Deferred tracing can be set on a system-wide basis using the
configuration console in the tracing page. Additionally, deferred
tracing can be set using the following command line set option
set tracedefer [-m <channelname> [on | off]
where:
- <channelname>
Is the name of the channel.
Server-wide deferred tracing is affected only when a channel
is initialized. When enabled on a per-channel basis through the
set command, the deferred mode activates only following the start
of the next message through the channel execution thread. That is,
it may take one or two messages before the mode is recognized.
x
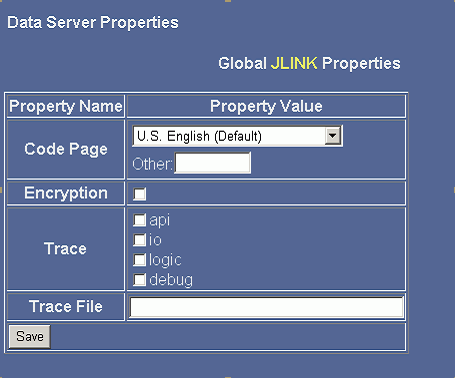
A separate category called jlink debug is used to mask
off trace messages arising in the iWay JDBC driver used to access
the main data server. Actual tracing levels for all instance of
the driver are specified in the driver settings in the Data Server
Properties configuration page.

You can also specify trace levels for specific instances of the
driver. The trace levels are:
- api. Causes
entry/exit tracing as the application steps through JDBC calls.
- io. Traces
data in and out of the system.
- logic. Traces
internal activity of the driver. Equivalent to the DEBUG level of
the server.
- debug. Traces
internal operations of the driver. Equivalent to DEEP level of the server.
The trace file specification is an entry that enables you to
route traces from the iWay JDBC driver to a specific file. If this
is not specified, the traces (in most cases) appear in the standard
server trace. Some more generalized services that use the iWay JDBC
driver do not pass traces through the server. In these cases, specification
of the external trace file enables the traces to be captured. You
will be asked to send this file to iWay as part of problem resolution.
