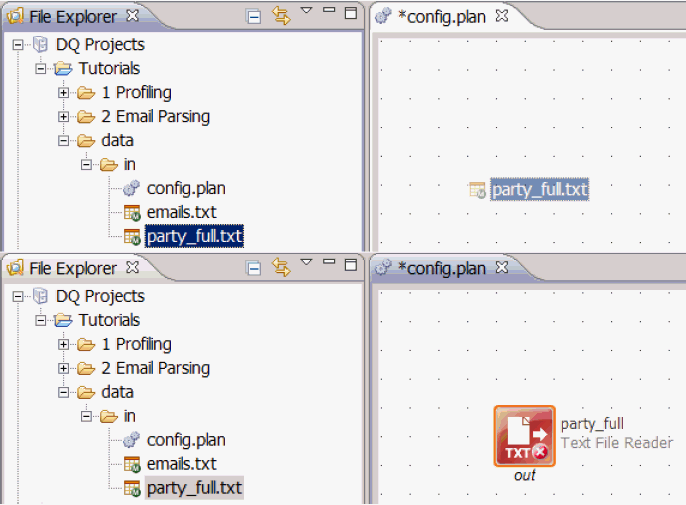
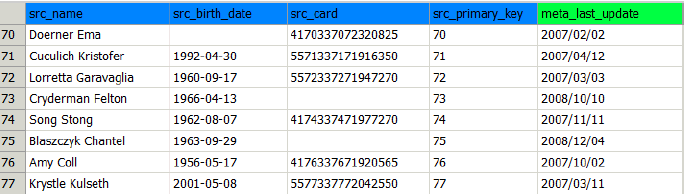
Double-clicking a text file (for example, a .txt or .csv file) will open it for viewing in the CSV Viewer, as shown in the following image.
The CSV Viewer displays the data in rows and columns, as defined in the file metadata.
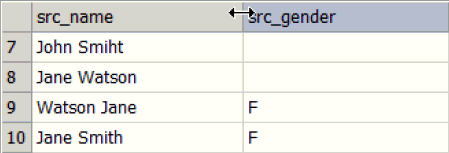
To sort a column, click the name of the column in the header row. Clicking once will sort the data in ascending order (for example, smallest-to-largest/A-to-Z), indicated by an up arrow. Clicking again will sort the data in descending order, indicated by a down arrow. Clicking a third time will remove all sorting and revert to the original ordering of the data, indicated by no arrow.
To show only a subset of the data, click the Switch View button in the toolbar, as shown in the following image.
This opens the View Settings dialog, which contains the Filter tab, as shown in the following image.
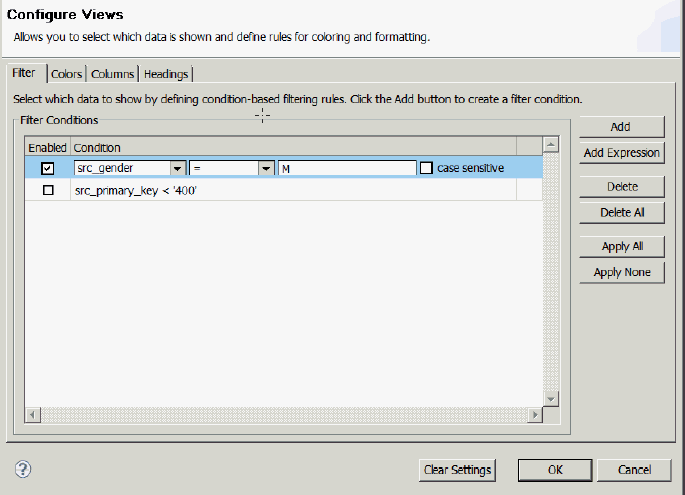
To define a filter, click Add. Use the drop-down lists to select a column to filter, and a condition to apply (for example, =, <, contains, and so on). Then specify the matching criteria. It is also possible to specify whether the filter should be case sensitive or not. This will display only rows matching the filter criteria. Multiple filters can be defined to further refine the data that is shown. To remove a filter without deleting it, clear the Enabled check box.
By default, all data will be shown in black text on a white background using the default font settings. However, rules can be configured so that certain data values or ranges are colored or formatted differently. This can be useful for visually scanning for key values in a large data file. The following list shows the conditions that are defined similarly to Filters, but containing additional options for coloring and text formatting (available through the Coloring column):
- Background. Defines the highlighting to apply to the cells.
- Foreground. Defines the text color.
- Bold. Click to make the text bold.
- Italic. Click to italicize the text.
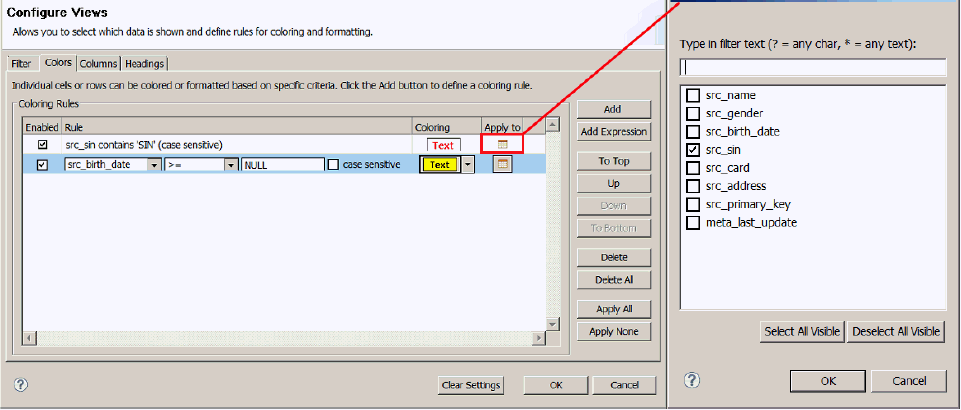
Optionally, you can define whether the coloring rule should be applied only to the specific cell which matches the coloring rule or to all (or any subset) of the columns (in the Apply to column), as shown in the following image.
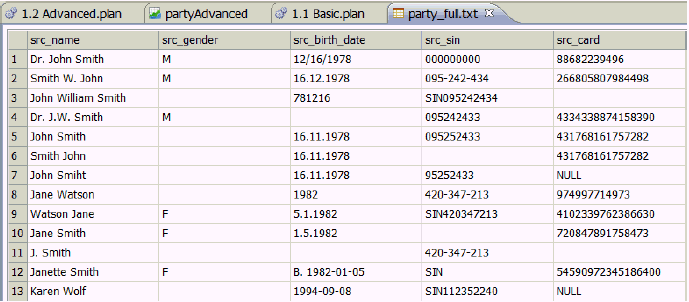
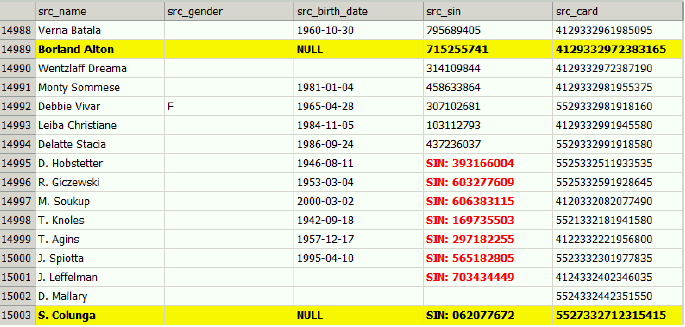
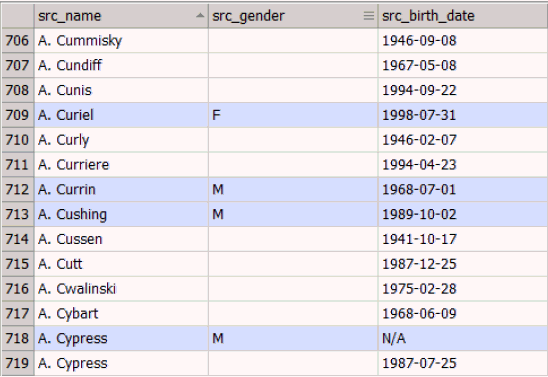
The following image shows how the data in the CSV Viewer will appear after the two coloring rules above have been defined and applied.
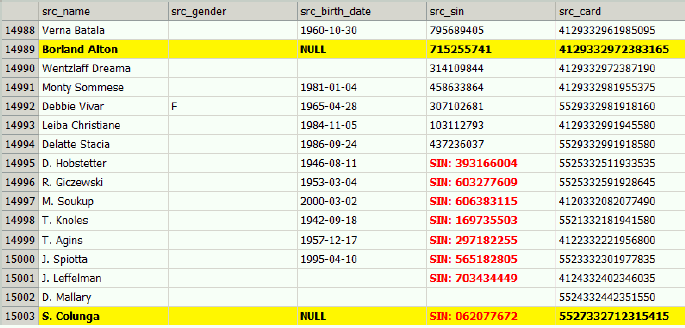
Coloring rules are applied in the order in which they appear. For example, the last line contains a cell with SIN in the scr_sin column, but the text inside is not painted red as defined in the Colors tab of the View Settings. This is because this rule is followed by the scr_birth_date >= 'NULL' rule. The order can be changed using the buttons on the right, below the Add button. If the order of the two rules are changed, the src_sin column in the last row will have a red font color instead of black. Since the background color was not defined for this rule, it is inherited from the other one and stays yellow, as shown in the following image.
For data files with many columns, it may be useful to hide certain columns to focus on specific data. This can be done in the Columns tab of the View Settings dialog. You can clear a column to hide it from view. When columns are hidden, a note appears at the bottom of the CSV Viewer indicating the number of columns that are hidden and providing a quick link to show them all. A column can also be hidden by right-clicking on it and selecting Hide Column.
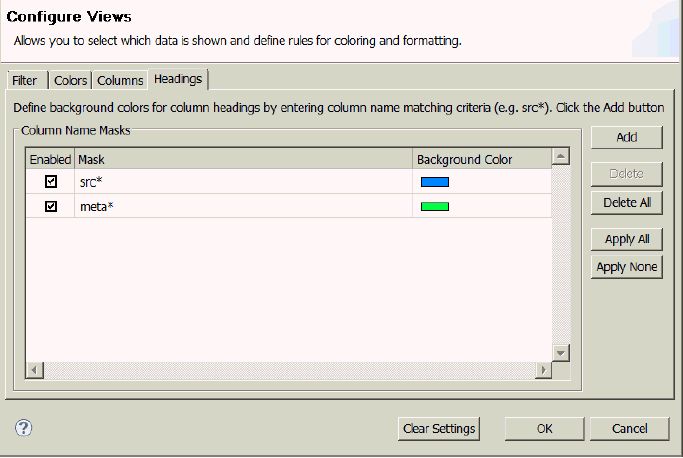
Many data files use standardized naming conventions to group similar columns. The View Settings dialog allows specifying different colors for column headers based on all or part of the column name. In the Headings tab, a column mask can be defined (for example, src*), which colors all headings which name starts with the text specified. A different background color can be set for each mask that is used, as shown in the following image.
The following image shows the result of the settings used above.
Column widths can be resized by dragging left or right when the mouse is placed over the column divider in the column header. Columns can be automatically sized to fit their contents by double-clicking the column divider, as shown in the following image.
Additionally, right-clicking on a column header will bring up a menu which offers, among other functions, the ability to autofit the selected column or all columns.
Another feature available in the column header context menu is the ability to visually mark changes (or identify groups) in data. This can be useful for scanning a specific column visually for changes in the data. The column whose groups are marked is indicated by an icon showing three parallel horizontal lines next to the column name, as shown in the following image.
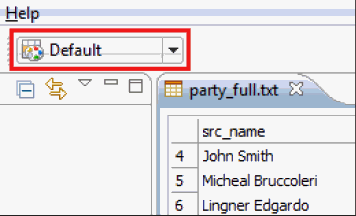
To preserve the view settings (including sorting, column widths, and marked groups) for later use, click the View Settings drop-down list to open the options menu, as shown in the following image.
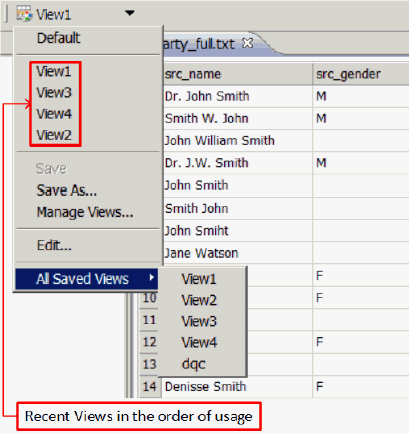
Click Save As (for creating a new saved view) or Save (for saving changes to an existing view) to store view settings. A list of recently used views will be shown at the top of the menu. A complete list of all saved views is shown in a submenu at the bottom, labeled All Saved Views. An asterisk (*) next to the view name indicates that unsaved changes have been made to the current view. To delete a view, select Manage Views. You can also import and export views for use with other copies of the product using this menu option.
The Default view is a stored view with no settings applied. It cannot be changed or deleted. When changes have been made to the Default view, the toolbar button label changes to <custom>, which indicates an unsaved view based on the default view. Click Save As to name and store the new view. The Edit option is the same as clicking the toolbar button with the view name, which opens the View Settings dialog.