Procedure: How to View a Data Quality Metric
To view a data quality metric:
-
Click the View icon in
the Manage Data Quality Metrics page.
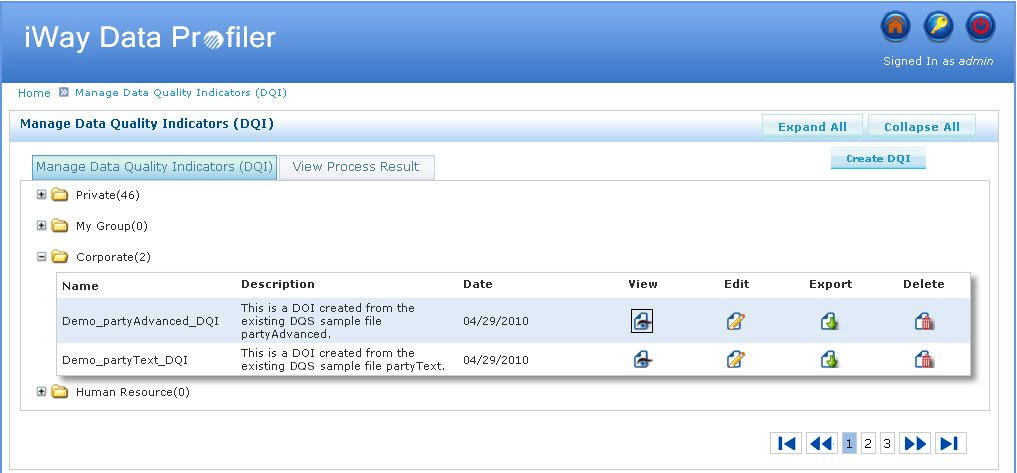
The View Data Quality Metric page opens, as shown in the following image.
The Individual Data Quality Report has been included to specify the variation in Success and failure % of different Metric Name.
The following is an explanation of the graph.
- The X-axis represents the DQI Expression.
- The Y-axis represents the Success and Failure Percentage.
- The DQI specifies the number of records that satisfy a condition (success Count) and the number of records that do not satisfy the same condition (Failure Count). The Success % and Failure % specifies the percentage of records that satisfies and dissatisfies the condition.