Viewing Data Quality Profiles
The following section describes how to view data quality
profiles in iWay Data Profiler using the various analytical options
that are available.
In IDP Version 9.0.1 and 9.0.1T, the Data Quality Profiles View
has been changed with a new user interface.
There are two drop-down lists available to view different reports
based on the selected Expressions:
- Type of Analysis
- Type of Profiles
x
The Type of Analysis drop-down list allows the user
to select the different types of profiles, and contains the following
values:
- Column Analysis
- Business Analysis
If the user selects Column Analysis, they
can view the Summary Report. If the user selects Business
Analysis, they can view Data Rules, Primary Keys, Dependencies,
and Foreign Key Reports.
x
The Type of Profiles drop-down list allows the user
to view different reports based on their selection, and contains
the following values:
- Summary
- Data Rules
- Primary Key
- Foreign Key
x
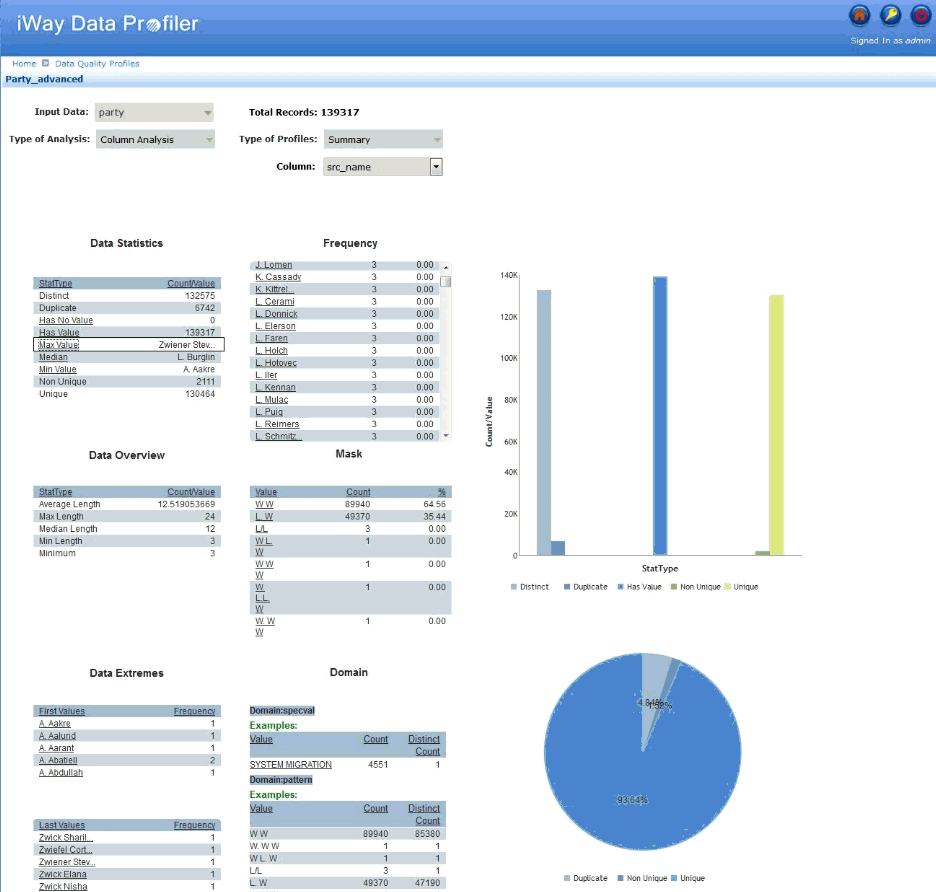
The Summary Report page opens as shown in the following
image.
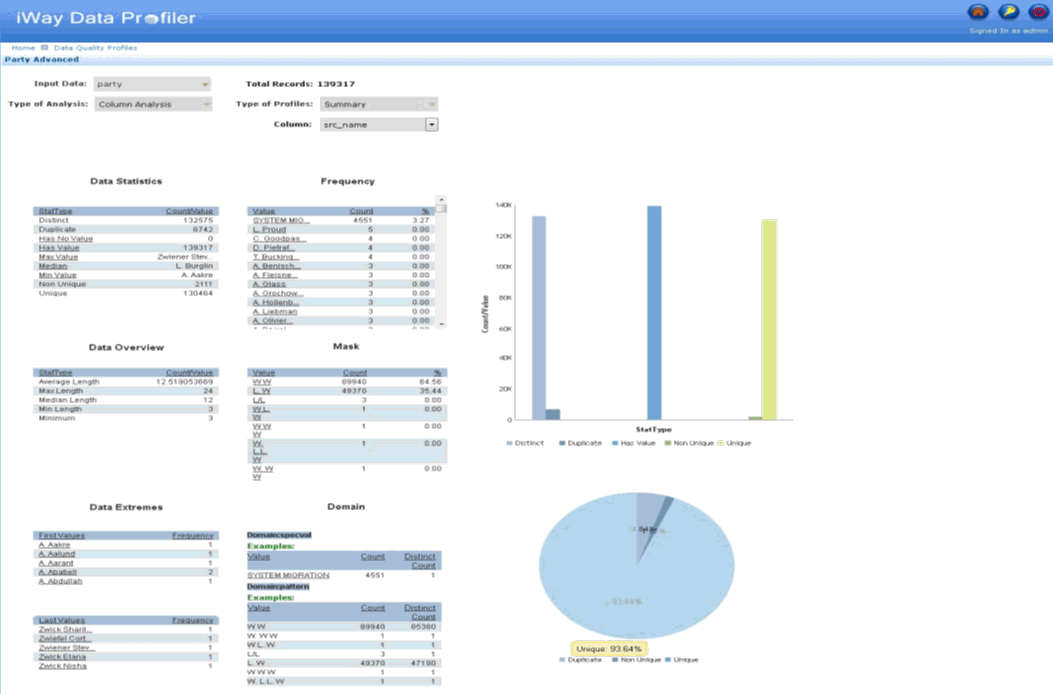
The summary report includes the following tables to analyze data:
-
Data Statistics. The data statistics table shows
the statistics about the profiled data and shows a chart of duplicate
and distinct data as a percentage of the whole.
This section displays
the stat type, count, and value of the selected expression.
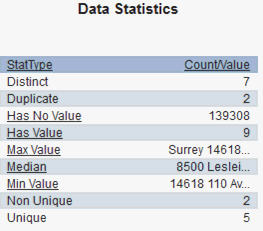
The StatType section
includes:
- Distinct
- Duplicate
- Has no Value
- Max Value
- Median
- Min value
- Non-unique
- Unique
Notes:
- Distinct values
are the total of Non-unique and Unique values.
- Duplicate values include all the repeated values. If only one
record is repeated three times, then non-unique becomes one and
duplicate becomes two.
-
Data Overview. The data overview table shows the overview
of analysis and provides information about average, maximum, and
minimum length of the data.
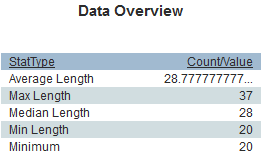
The Data Overview
section includes the following values and their corresponding frequencies:
The
following common list of items for all data types includes the following:
- Minimum Value
- Median Value
- Maximum Value
If the data type is day or datetime,
in addition to the common list of items, it includes the following:
- Average
- Variance
- Standard Deviation
If the data type is string, in
addition to the common list of items, it includes the following:
- Minimum length
- Median length
- Average length
- Maximum length
If the data type is integer, long,
or float, the type drop-down list, in addition to the common list
of items, includes the following:
- Average
- Variance
- Standard Deviation
- Sum
If the expression is day, in addition to the
common list of items, includes the following:
- Average
- Variance
- Standard Deviation
-
Data Extremes. The data extremes table shows simple extremes
about the first and last values of the data.
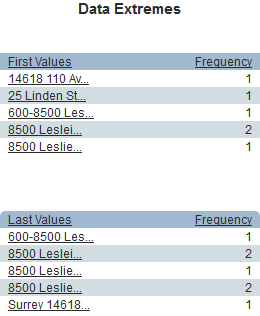
The Extremes section
includes the following values and their corresponding frequencies:
- Top five values
- Bottom five values
Note: The default value
for Extremes in DQS is 5. This value can be changed while
creating profiles.
-
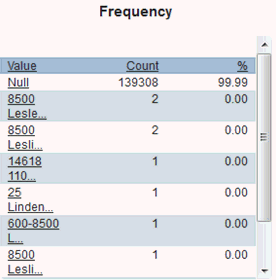
Frequency. The Frequency table shows the number of times
each value in the data occurs (both as an absolute count and as
a percentage of the whole).
The Frequency section shows the Count,
Values, and Percentage of the selected expression.
-
Mask. The Mask table specifies the number of times (Count)
a particular format of data (Value) is repeated and calculates the
percentage based on the count.
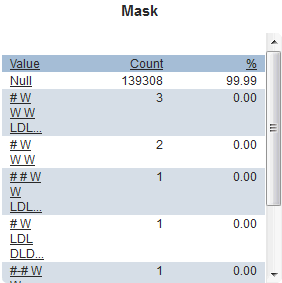
The formats of data
include:
-
D. Single digit.
-
N. Sequence of more digits.
-
L. Single letter.
-
W. Sequence of more letters.
-
One space. Sequence of whitespace characters.
-
U. Control character or character not defined in Unicode.
- In addition, any other characters specified in the profile component.
-
Domain. The Domains report is used to perform domain
analysis of data.
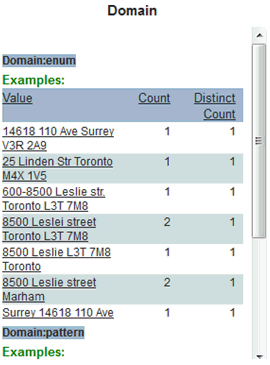
The available domains
are:
-
Numeric. Discovers numeric values coded as
string.
-
Datetime. Discovers date or date-time values coded as
string.
-
Enum. Discovers the column that acquires a limited number
of values.
-
Specval. Discovers the column that acquires one or a
few values that occurs more frequently than usual.
-
Pattern. Discovers string values that conform to few patterns.
Note: The values are displayed in the legend but not in
the graph report of iDP application. This is due to indiscriminant
values in the database while creating profile.
x
The Drill-through functionality allows you to view the
individual records that comprise the statistics that are generated.
Clicking the link in the data table allows you to access the drill-through
functionality.
A drill-through report can be viewed in all Profiles (Summary,
Primary Keys, Data Rules, Dependency, and Foreign Keys).
Note:
- The iDP Version 9.0.1 database (idp_data) and the database
used by iWay DQS for creating the drill-through tables can be any
RDBMS supported database type, such as Oracle, SQL Server 2005 and
higher, or MySQL.
Note: The iDP Version 9.0.1T database
(idp_data) and the database used by iWay DQS for creating the drill-through
tables can be any RDBMS supported database type, such as Oracle,
SQL Server 2005 and higher, MySQL, or Teradata.
- You must create the adapter for drill-through functionality
using the connection name, IDP_DRILLTHROUGH, which must be configured
with the database that DQS uses to create a drill-through.

x
Select Primary Keys from the
Type of Profiles drop-down list in the View Data Quality Profiles
page, as shown in the following image.
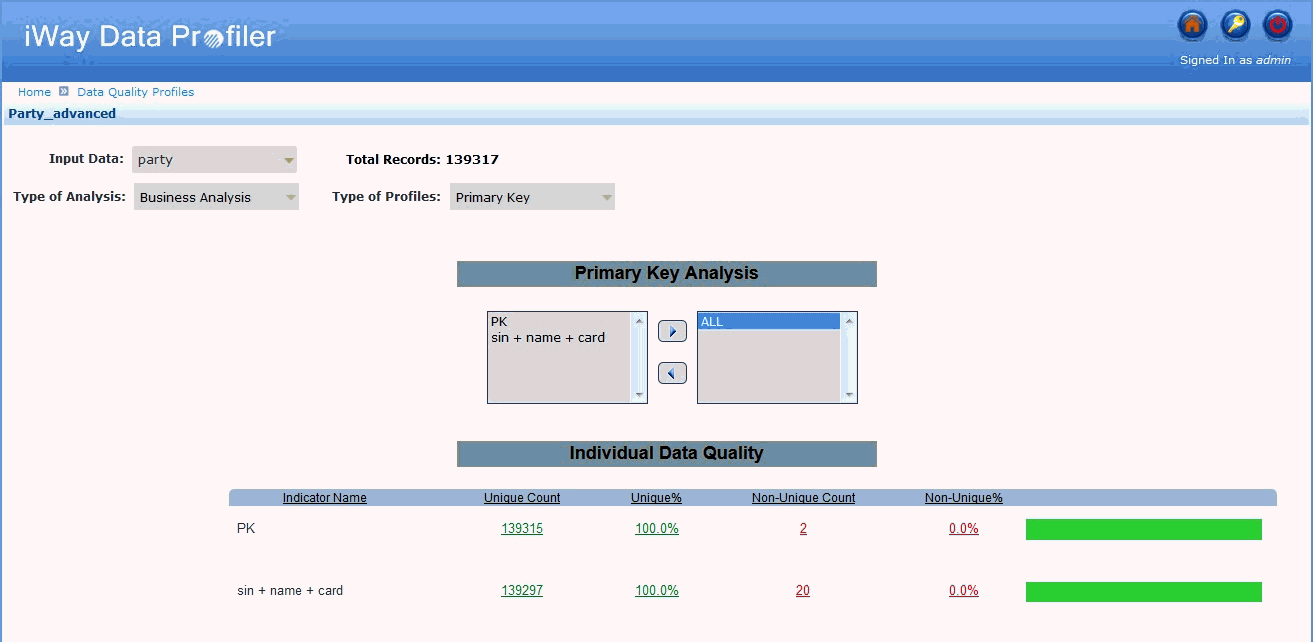
The Primary Keys report analyzes the uniqueness of designated
keys.
The generated graph displays the non-unique, unique, and null values.
x
Select Data Rules from the Type
of Profiles drop-down list in the View Data Quality Profiles page,
as shown in the following image.
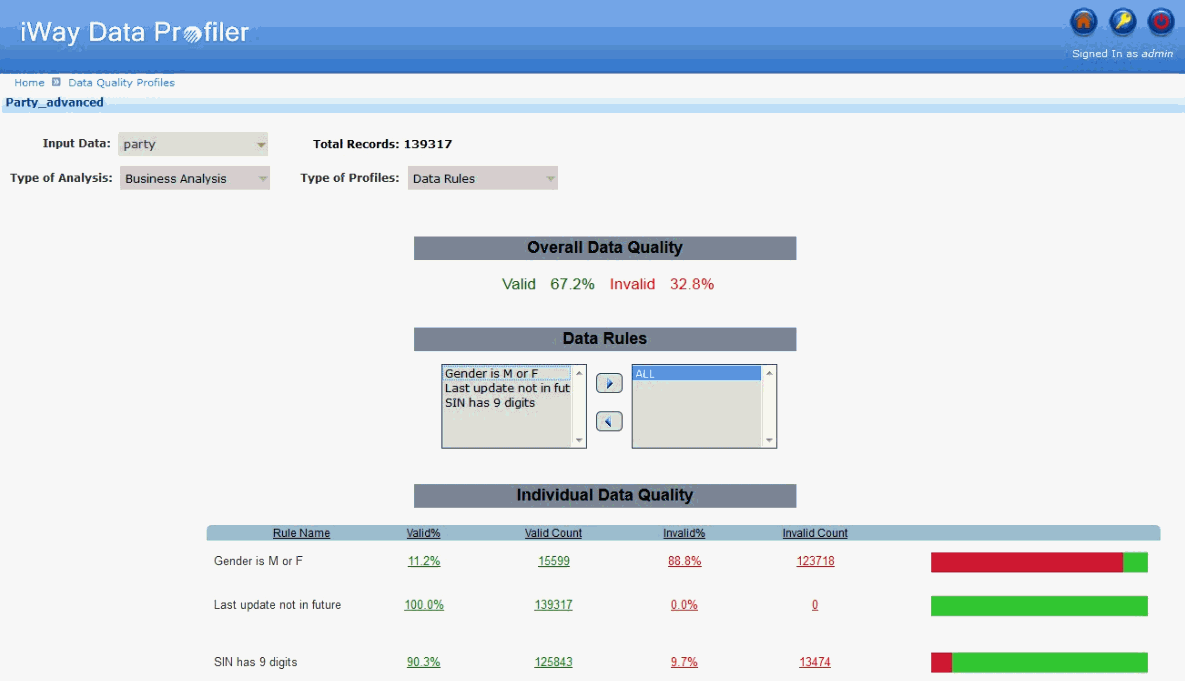
The Data Rules report shows how much data satisfies the data
rules.
The Individual Data Quality report shows the valid and invalid
percentage, and count for each rule name.
The generated graph displays the total number of null records,
the number of records that satisfy the data rules, and the number
of records that do not satisfy the data rules.
x
Select Dependency from the Type
of Profiles drop-down list in the View Data Quality Profiles page,
as shown in the following image.
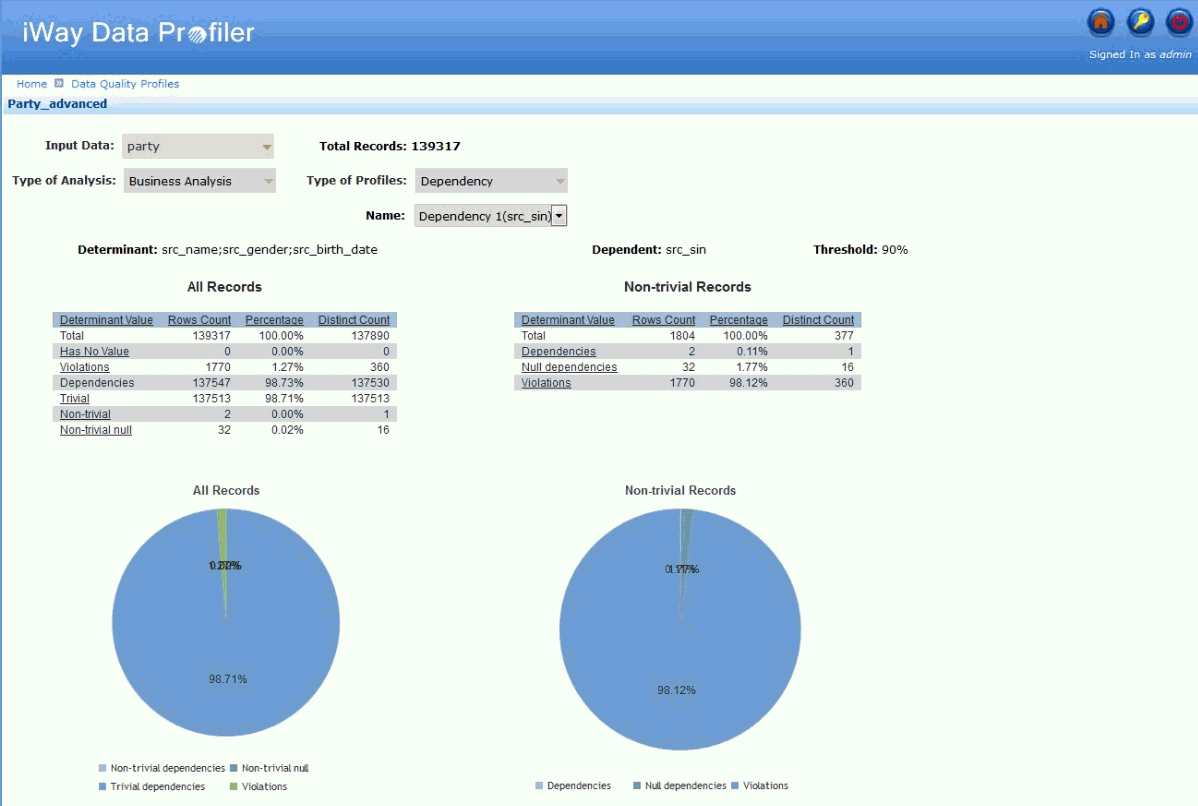
The Dependency report shows how much a particular data is dependent
on other data. The Determinants and Dependents are specified by
the user in the DQS Plan.
The Dependency section displays the Name, Determinant, Dependent,
and Threshold.
It also displays the Rows count, Rows count percentage, and Distinct
Count for the following:
- Total Records
- Null Determinants
- Violations
- Dependencies (Trivial and Non Trivial)
It further displays the Rows count, Rows count percentage, and
Distinct Count for the following:
- Total Non Trivial Records
- Non Trivial Violations
- Non Trivial Dependencies
For more information, see the iWay DQS Reference Guide.
x
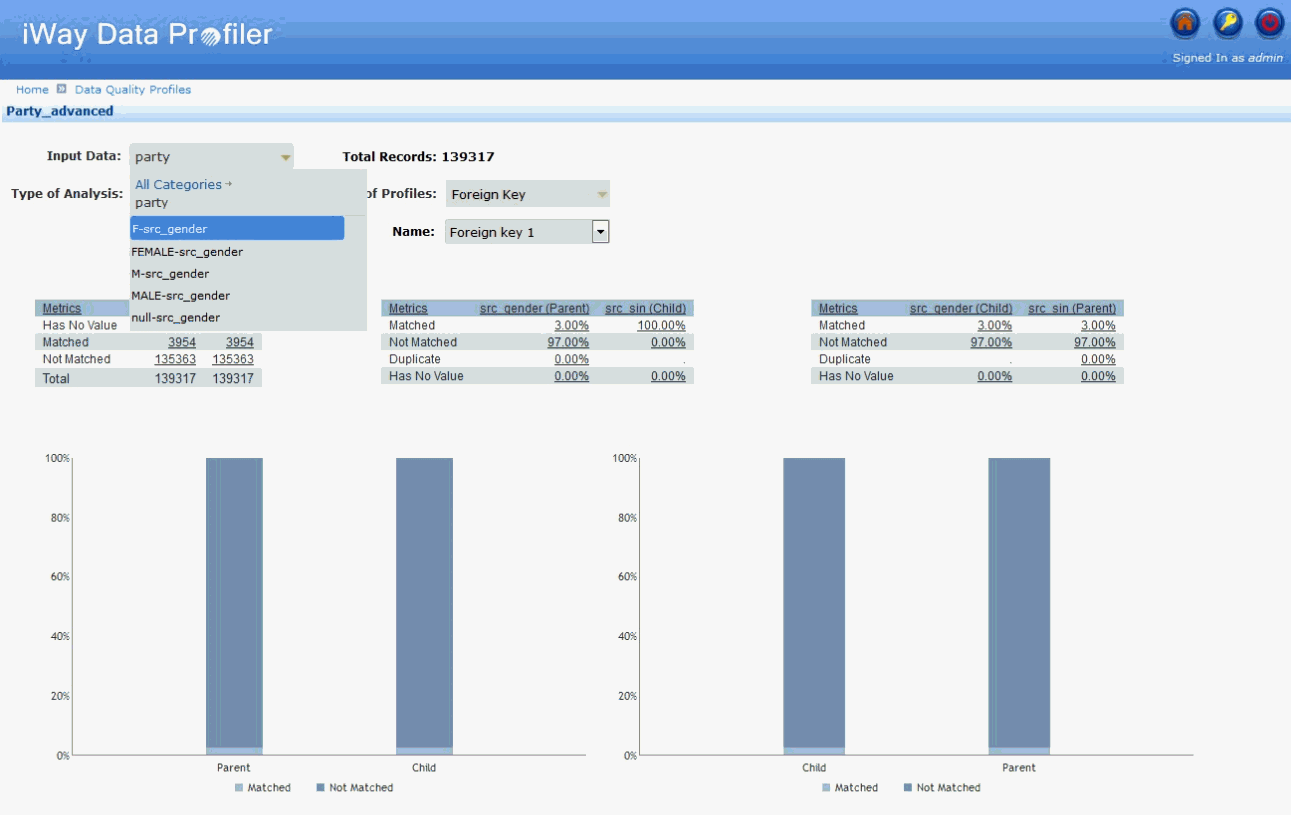
Select Foreign Keys from the
Type of Profiles drop-down list in the View Data Quality Profiles
page, as shown in the following image.
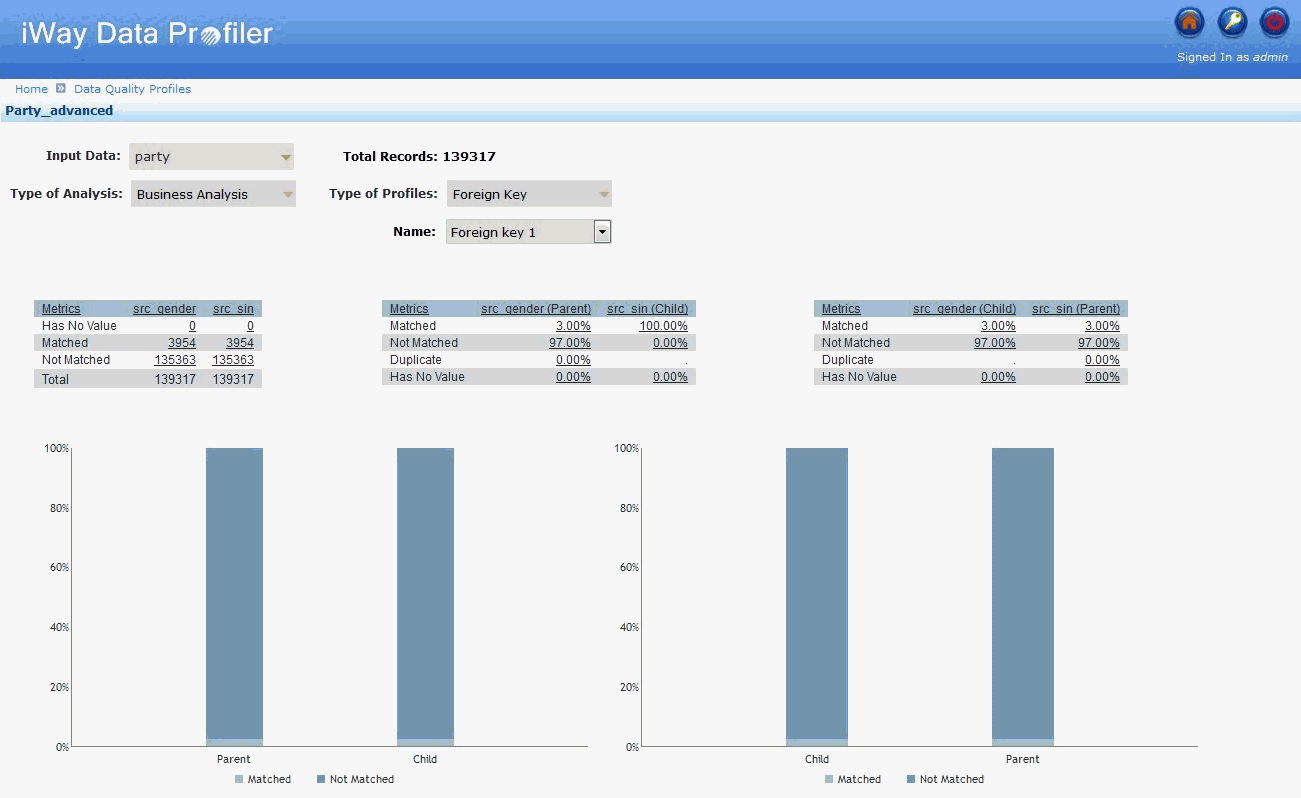
This report analyzes the column or combination of columns that
is used to establish and enforce a link between the data in two
tables of designated keys. A graph is generated to show the matched,
not-matched, null, and duplicate values.
Note: If the duplicate value is missing in the XML profile,
then the foreign key report in the iDP application value for the
field name duplicate will be blank.
x
Roll Ups display a profile of a subset of data, divided
based on one or multiple columns.
Click the Input drop-down list to view the roll up items of the
particular input. After clicking any one of the roll up items, the
corresponding profile is loaded, as shown in the following image.
