The Dashboard tab allows users to receive real-time system information. The dashboard consists of tabs, which include widgets. Each tab can have a different layout depending on the number of widgets that need to be rendered.
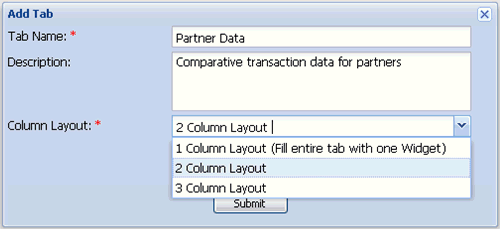
To add a new tab, click the Add Tab button.

Provide the required information and click Submit. This will generate a new tab which can contain multiple widgets.
The Column Layout drop-down list provides the following options:
- 1 Column Layout. Fill entire tab with one Widget, which is useful for rendering reports.
- 2 Column Layout. Two widgets can be displayed in two columns.
- 3 Column Layout. Three widgets can be displayed in three columns.
Once there is a tab available, a widget can be added to render data. Click the Add Widgets button to add a widget to a given tab.

The following types of widgets are available:
- URL Widget. Contains only the URL content returned, enabling link to the external applications.
- Chart Widget. Contains metrics rendering as a chart.
- Pre Defined Widget. Contains pre-defined metrics charts.
- Enable Widget. Contains portlets defined in iWay Enable that can be rendered as widgets in the iWay Business Activity Monitor console.
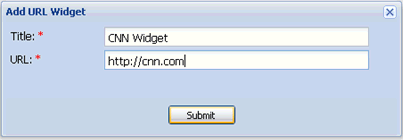
To configure a URL widget, provide a URL link for the widget configuration and click Submit.

The newly configured URL widget is available under the tab.
A chart widget can be configured if metric values are being captured by the application. For more information on capturing data metric values, see Application Configuration Requirements.
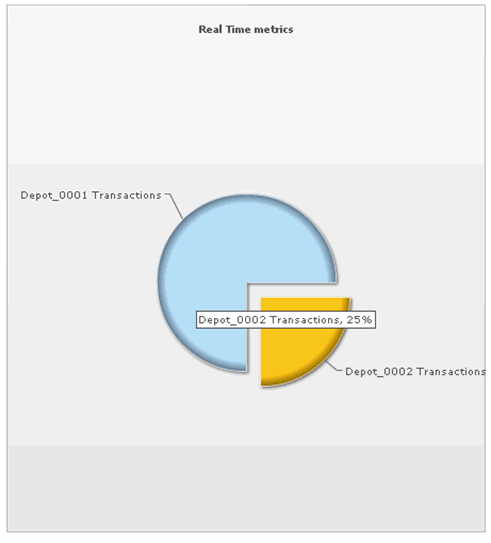
To configure a Chart Widget, select the available chart type to be used for display and add as many metric values for rendering as required for the widget. For example, you can compare sales by Depot, as shown in the following image.

The data is rendered in the created widget at real-time.
