In this section: |
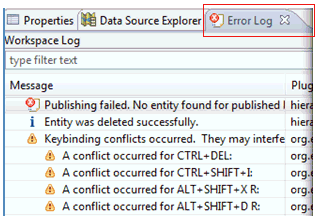
The Error Log tab in the Hierarchy Perspective captures all the warnings and errors logged by the iWay Hierarchy Manager plugin. The underlying log file is a .log file stored in the .metadata subdirectory of the workspace. To access the Error Log tab manually, click Window in the menu bar, select Show View, and then click Error Log.

Events in the Error Log tab can be sorted by message, plug-in ID, or date in ascending or descending order. Click on the column name that you want to sort by. The down arrow in the column header indicates descending order and the up arrow indicates an ascending order.
Events in the Error Log tab can be grouped by session or plug-in ID. Click the drop-down arrow in the Error Log tab toolbar and select Group By.
You can filter the Error Log tab to show events of a particular type or session. Also, you can limit the number of entries in the view. Click the drop-down arrow in the Error Log tab toolbar and select Filters.
To import an arbitrary .log file into the Error Log tab to be viewed, click the Import Log button on the toolbar or select Import Log from the context menu. Then, select a .log file from your file system.
To export the current log content into a file, click the Export Log button on the toolbar or select Export Log from the context menu. Then, enter a file name for the log.
To clear the current view log content without deleting the underlying .log file, click the Clear Log button on the toolbar or select Clear Log Viewer from the context menu.
To permanently delete the underlying .log file, click the Delete Log button on the toolbar or select Delete Log from the context menu.
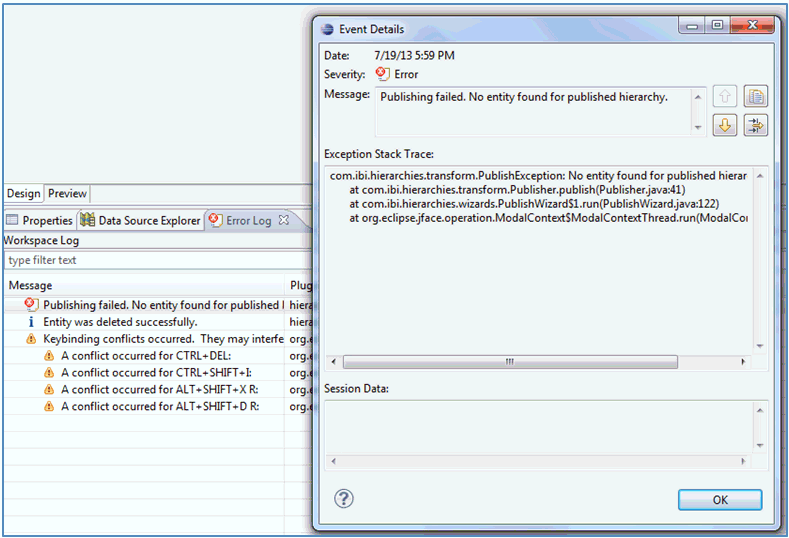
Full details about a specific event can be viewed in the Event Details dialog box by double-clicking on a particular entry or by right-clicking an entry and selecting Event Details from the context menu. The Event Details dialog box opens, as shown in the following image.

You can view the date, severity, message, exception stack trace (if available) and session data of each event. You can navigate from one entry to the next by clicking the up and down arrow buttons. To copy the error message to the clipboard, click the clipboard icon.
| iWay Software |