Performing Diagnostic Functions

In this section:

How to:

Reference:

The iWay Service Manager Administration Console enables you to configure diagnostic properties for logging and tracing. After logging and tracing properties are enabled, you can view the resulting log files in the console.


Top of page

x
Log Settings

The Trace Log is used to record the diagnostic information that is generated by the run-time components of iWay Service Manager. The Transaction Log is used to maintain a record of every document received and processed by iWay Service Manager. The following procedure describes how to configure log settings that are defined in the base configuration of iWay Service Manager.


Top of page

x
Procedure: How to Configure Log Settings

To configure log settings:

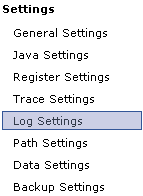
  1. In the left console pane of the Server menu, select Log Settings.

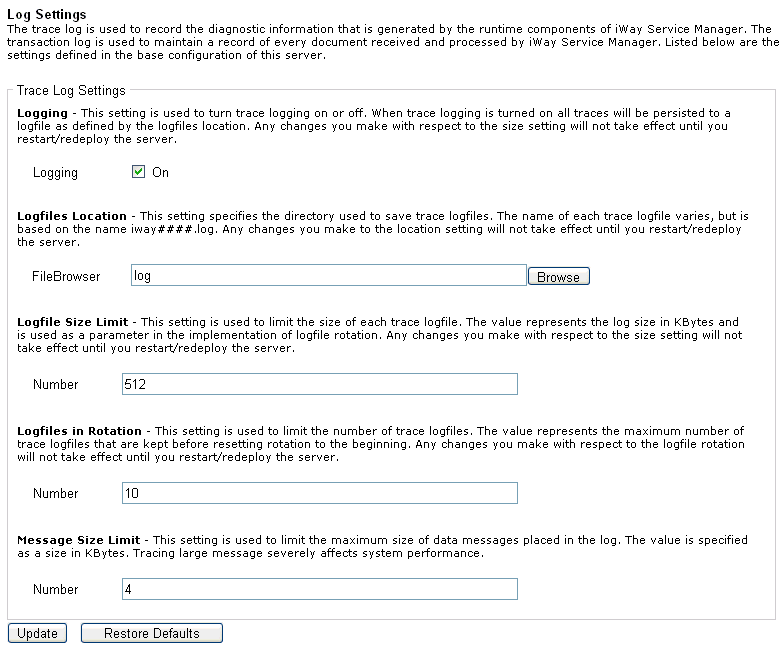
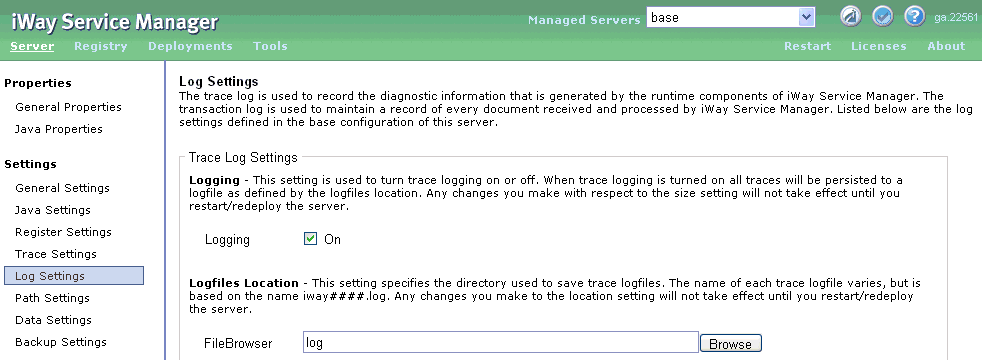
    The Log Settings pane displays, as shown in the following image.

  2. Change the default values.

    For more information, see Log Setting Properties.

  3. Click Update.
  4. For your changes to take effect, restart iWay Service Manager.

Top of page

x
Reference: Log Setting Properties

The following table lists and describes the log setting properties.

Property

Description

Trace Log Settings

Logging

Turns logging on or off. Required if you want to log to a file, use a diagnostic activity log, or view the log online.

Logfiles Location (Directory field)

Directory where the trace log root resides. To create the directory if it does not exist, select the check box.

Logfile Size Limit (Number field)

Maximum allowed for each file size in kilobytes (used for log rotation). iWay recommends a minimum of one megabyte.

Logfiles in Rotation (Number field)

Maximum number of files to keep (used for log rotation).

Message Size Limit (Number field)

Maximum size of the data message in a log file measured in kilobytes. Large trace messages affect system performance.


x
Trace Settings

Tracing is key to diagnosing problems and thus to application reliability. iWay Service Manager provides a full complement of tracing services, oriented to diagnostic analysis of the running system. Tracing provides a step-by-step explanation of the internal activity of the server.

It is important to note that tracing can affect system performance. The iWay Service Manager Administration Console enables you to select the levels of traces that you want to generate. Unless you are diagnosing a problem, you should limit tracing to error-level only.

A separate category called JLINK debug masks trace messages originating in the iWay JDBC driver that is used to access the main data server. You can specify actual tracing levels for all instances of the driver in the driver settings of the Data Server Properties configuration window. For more information, see How to Activate JLINK Tracing.

The following procedure describes how to control the amount of detail that is produced by the diagnostic components embedded within iSM. Traces produced during run time are displayed or logged based on settings in the run-time environment.


Top of page

x
Procedure: How to Select Trace Levels

To select trace levels:

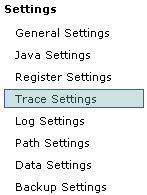
  1. In the left console pane of the Server menu, select Trace Settings.

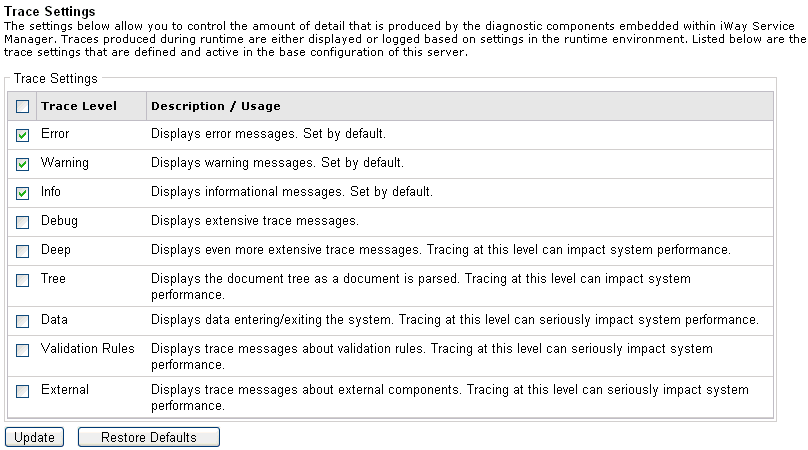
    The Trace Settings pane displays, as shown in the following image.

  2. If other than the default trace levels (Info and Error) are required, select the desired trace level check box.

    For more information, see Trace Setting Properties.

  3. Click Update.

Top of page

x
Reference: Trace Setting Properties

The following table lists and describes the trace setting properties.

Trace Level

Description

Error

Displays error messages. This trace level is set by default.

Warning

Displays warning messages. This trace level is set by default.

Info

Displays informational messages. This trace level is set by default.

Debug

Reports data that is helpful for debugging situations. Shows logic that tracks the path of a document.

Deep

Used for detailed logic tracing. Stack traces are reported by the system in deep debug level. Use only if instructed to do so by iWay Support.

Caution: Tracing at this level can impact system performance.

Tree

Displays the document as it enters and leaves the system in XML form. This is a level at which intermediate processing as a document evolves is done.

Caution: Tracing at this level can impact system performance.

Data

Displays the incoming and outgoing documents as they pass to and from the protocol channel.

Caution: Tracing at this level can impact system performance.

Validation Rules

Displays trace messages about validation rules.

Caution: Tracing at this level can impact system performance.

External

Displays trace messages about external components.

Caution: Tracing at this level can impact system performance.


x
Procedure: How to Log Traces to a File

If tracing is turned on without logging, the tracing information appears only in the debug window and is not saved to a file.

To log traces to a file:

  1. In the left console pane of the Server menu, select Log Settings.

    The Log Settings pane opens.

  2. In the Logfiles Location section, specify the path to the directory used to save log files.
  3. Click Update.
  4. For your changes to take effect, restart iWay Service Manager.

Traces are available in several levels and controlled independently. For more information, see Trace Setting Properties.

Note: Trace settings for managed configurations must be set for each configuration independently.

All levels can be masked, so that the log contains only brief informational and error messages.

Unlike most design time settings, changing trace levels takes immediate effect in the run-time system. Changing the log file location does not take effect until iWay Service Manager is restarted.


Top of page

x
Procedure: How to Activate JLINK Tracing

To activate JLINK tracing in iWay Service Manager:

  1. In the left console pane of the Server menu, select Data Settings.

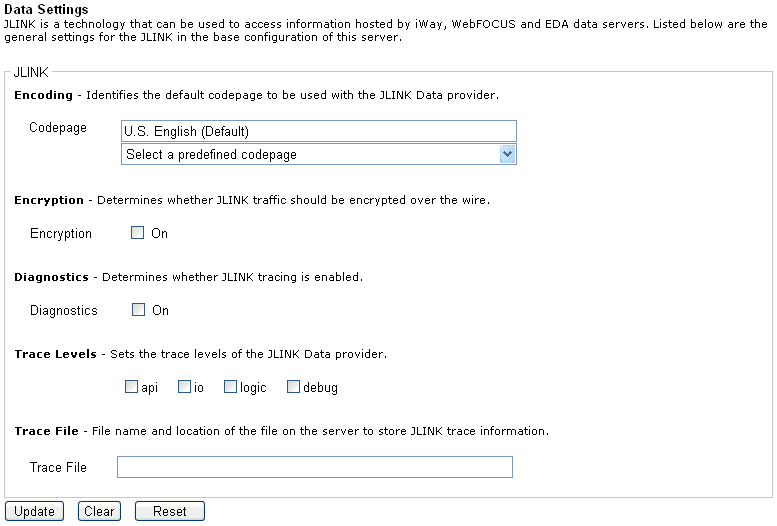
    The Data Settings pane opens, as shown in the following image.

    1. Select the Diagnostics check box.
    2. Specify trace levels for specific instances of the driver.

      The trace levels are:

      api. Provides entry/exit tracing as the application steps through JDBC calls.

      io. Traces data in and out of the system.

      logic. Traces the internal activity of the driver. This is equivalent to the Debug trace level of the server.

      debug. Traces internal operations of the driver. This is equivalent to the Deep Debug trace level of the server.

    3. Type the name of the trace file in the Trace File field.

      The trace file specification enables you to route traces from the iWay JDBC driver to a specific file. If you do not specify a trace file, the traces (in most cases) appear in the standard server trace. Certain generalized services that use the iWay JDBC driver do not pass traces through the server. In these cases, specification of the external trace file enables the traces to be captured. You may be prompted to send this file to iWay Support as part of the problem resolution process.

  2. Click Update.

iWay Software