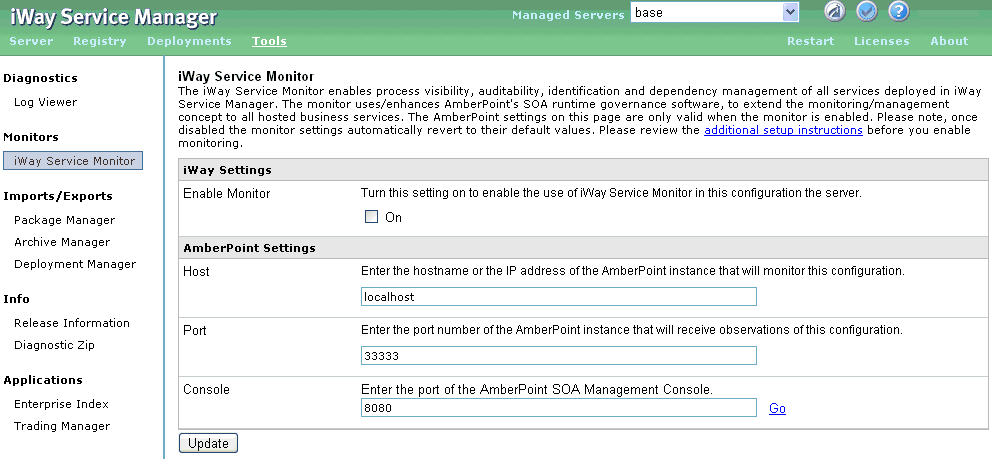
iWay Service Monitor enables process visibility, auditability, identification, and dependency management of all services deployed in iWay Service Manager. With this component, iWay implements SOA runtime governance and extends the monitoring/management concept to all iWay services, message services, and business services. The settings on this page are only valid when IWay Service Monitor is enabled.

Note: When monitoring is disabled, the monitor settings automatically revert to their default values.
While iWay Service Monitor can be automatically configured to manage and monitor services, the following procedure is used to manually configure monitoring of services running on iWay Service Manager. For information on automatic monitoring, see Setting Up iWay Service Monitor.
To enable iWay Service Monitor:
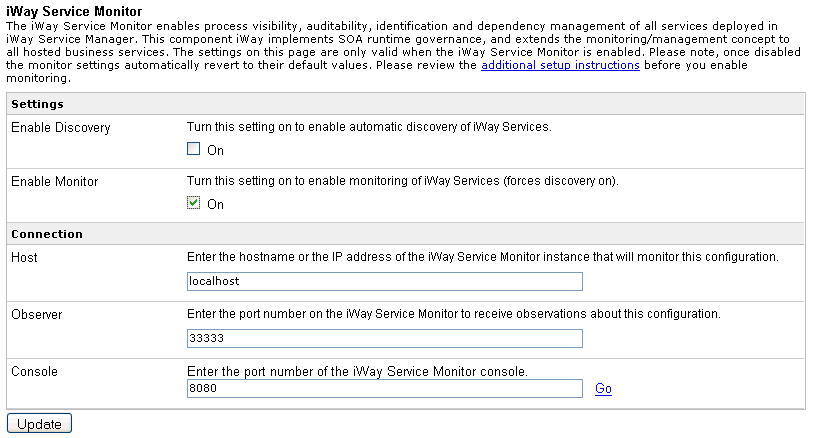
Note: To enable the automatic discovery of services, select the On check box for the Enable Discovery option.
The host name or IP address of the IWay Service Monitor instance that will monitor this configuration.
The port number of the IWay Service Monitor instance that will receive observations about this configuration.
The port number of the IWay Service Monitor console.
The Enable Discovery option is used to register a WSDL document with AmberPoint so that it can be managed. The Enable Monitor option is used to send copies of request and response messages to AmberPoint so that statistics on a particular service can be gathered. In previous releases, these two functions were merged. They are now separate functions and can be selected independently on the iWay Service Monitor page. This enables better Proxy abilities in AmberPoint.
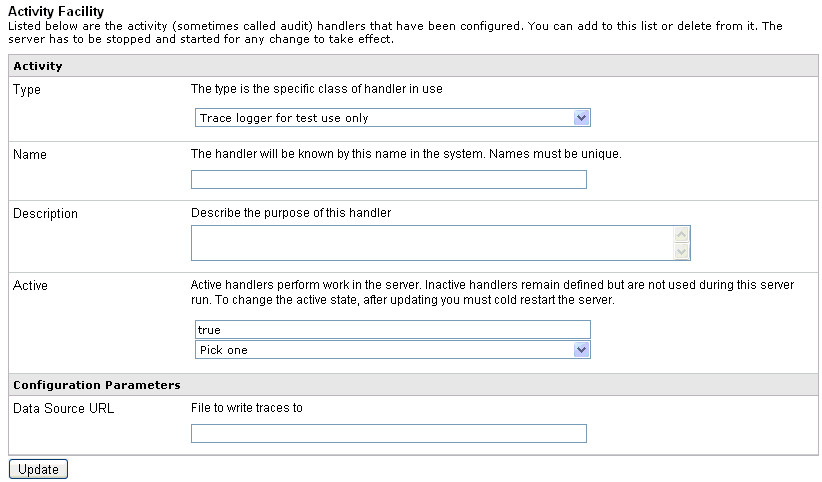
To configure channel monitoring:

The Activity Facility page opens.

The Activity Facility configuration page opens.

The iWay Service Monitor page opens.
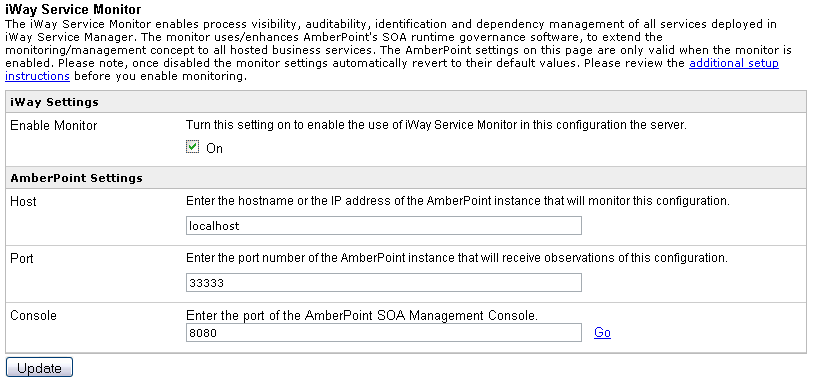
Note: A channel that is already deployed can not be monitored unless it is redeployed.
For additional diagnostic information, go to the Deployments section to see all the deployed channels and their WSDLs.
A custom Web page that provides the description, listener type, and start/stop management of the monitored channel is available. It is hosted on iWay Service Manager but must be added to the AmberPoint Management Console as an external page portlet. This page is not accessible from the iWay Service Manager Administration Console. To access this page in a browser, use the following URL:
http://host:port/ism/apchannels?configuration=configname
where:
Is the host machine where iWay Service Manager is installed. The default value is localhost.
Is the port where iWay Service Manager is listening. The default port is 9999.
Is the name of the iWay Service Manager configuration you are using. The default configuration is base.
To add an external page portlet using the AmberPoint Management Console to deploy up and down channels:
The AmberPoint Management Console logon page opens.
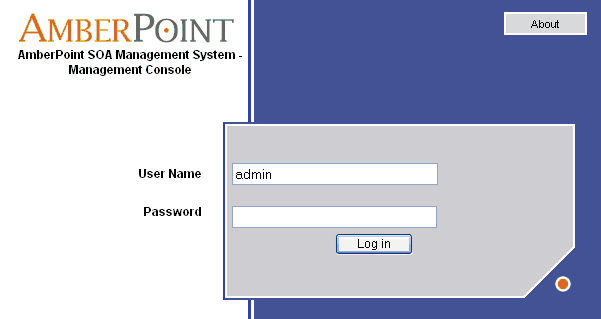
The main page of the AmberPoint Management Console opens, as shown in the following image.
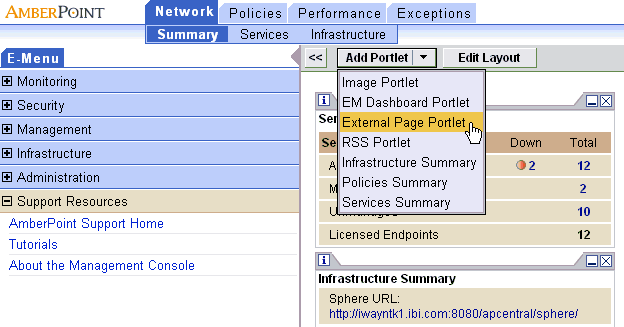
The Add External Page Portlet pane opens, as shown in the following image.
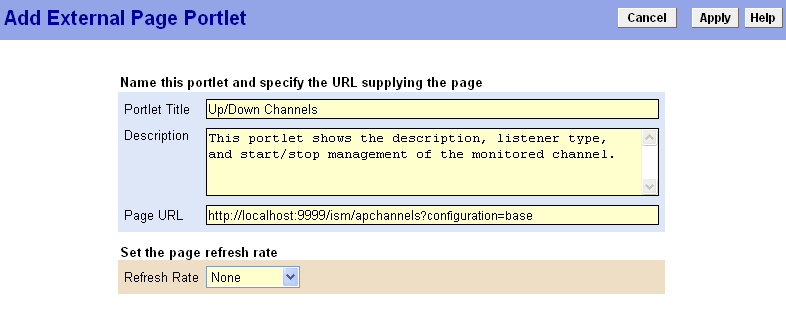
http://host:port/ism/apchannels?configuration=configname
where:
Is the host machine where iWay Service Manager is installed. The default value is localhost.
Is the port where iWay Service Manager is listening. The default port is 9999.
Is the name of the iWay Service Manager configuration you are using. The default configuration is base.
The external page portlet is now available in the AmberPoint Management Console.
| iWay Software |