Tracing

In this section:

Tracing is key to diagnosing problems and thus to application reliability. iWay Service Manager provides a full compliment of tracing services, oriented to diagnostic analysis of the running system. Tracing provides a step by step explanation of the activity of the server internals.

Experience teaches that tracing can also be a major source of performance degradation. The iWay console enables you to select the levels of traces that you wish to generate and display. Unless you are diagnosing a problem, you will usually want to limit the tracing to error level only.

Traces are offered in several levels, controlled independently:

Trace

Description

BIZERROR

Shows error messages associated with processing a document. Rule violations such as errors detected during analysis of EDI documents are BIZERROR level.

DATA

Shows the incoming and outgoing documents as they pass to and from the protocol channel.

DEBUG

Reports data that is helpful for debugging situations. It shows logic that tracks the path of a document.

DEEP

Used for detailed logic tracing. Stack traces are reported by the system in DEEP level. Usually you will use this level only if instructed to do so by iWay support personnel.

ERROR

Shows error messages relating to operation of the adapter. This level always displays.

INFO

Provides messages that the user always needs to see to verify activity. The server puts out almost no messages at INFO level.

TREE

Shows the document as it enters and leaves the system in XML form. Intermediate processing as a document evolves is done at TREE level.

All except INFO and ERROR levels can be masked off, so that the log contains only brief informational and error messages.

Control of tracing is controlled in the Configuration System Properties Diagnostics page of the console. It offers the ability to set the log directory, manage the size of the log files, and turn logging on and off. Unlike most design time settings, changing trace levels takes immediate effect in the run time system. Changing the log location does not take effect until the next restart of the system.


x
Jlink Debug

A separate category called jlink debug is used to mask off trace messages arising in the iWay JDBC driver used to access the main data server. Actual tracing levels for all instance of the driver are specified in the driver settings in the Data Server Properties configuration page.
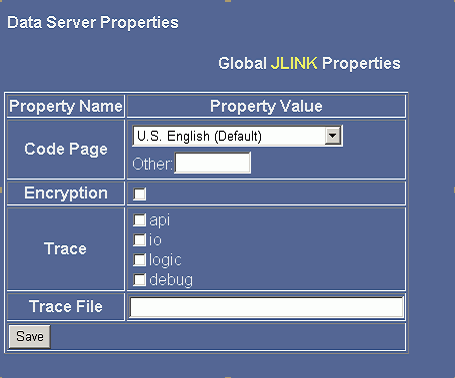
You can also specify trace levels for specific instances of the driver. The trace levels are:

The trace file specification is an entry that enables you to route traces from the iWay JDBC driver to a specific file. If this is not specified, the traces (in most cases) appear in the standard server trace. Some more generalized services that use the iWay JDBC driver do not pass traces through the server. In these cases, specification of the external trace file enables the traces to be captured. You will be asked to send this file to iWay as part of problem resolution.


iWay Software