TThe following sections describe the available API calls,
including their associated parameters and operations, which are
provided with iWay Enable.
x
All iWay Enable JavaScript objects extend the following
Support object.
iwenable.Support()
Parameters: None
All iWay Enable objects inherit the following operation. The
operation renders the HTML and embeds the iWay Enable gauge or chart
into the document.
render(url)
| Parameter
| Type
| Description
|
|---|
| url
(Optional)
| String
| Specifies the URL for
the XML file that renders the gauge or chart. If you supply a URL,
it will override the value in the config parameter passed in the
constructor of the extending object. |
x
iwenable is the iWay Enable namespace for all iWay Enable
public APIs.
The namespace summary and detail are listed below:
- iwenable
-
Is the iWay Enable namespace, under which all iWay Enable
APIs reside.
Method Summary:
- <static> {String} iwenable.dom2String(doc)
-
Serializes a DOM object into an XML string.
Parameters:
- {Object}doc
-
Is the DOM object to be serialized.
Returns:
- {String}
- Is the serialized string of the DOM object.
Method Summary:
- <static> {Object} iwenable.getDocument(xml)
-
Deserializes from an XML string into a DOM object.
Parameters:
- {String}xml
-
Is the XML string to be parsed.
Returns:
- {Object}
- Is the parsed XML DOM object.
Method Summary:
- <static> {String} iwenable.getVersion()
-
Returns the iWay Enable API version.
Returns:
- {String}
- Is the version number.
Method Summary:
- <static> {Object} iwenable.object2Dom(object,rootName)
-
Constructs a DOM object from a Javascript object.
Parameters:
- {Object}object
-
Is the Javascript object to convert into a DOM object.
- {String}rootName
-
Is the name of the root element in the constructed DOM object.
Returns:
- {Object}
- Is the DOM object that was converted from a Javascript object.
x
Active reports are grid objects that allow special manipulation
and configuration. An example of an active report is shown in the
following example:
This API call creates an active report:
iwenable.ActiveReport(ctxt,id,debug,config,customData)
The Enable active report class wraps the active report library
and provides integration with Enable dataset feeds.
| Parameter
| Type
| Description
|
|---|
| ctxt
| String
| Specifies a relative or
absolute path to the iWay Service Manager. |
| id
| String
| Specifies the ID of the
HTML element that the grid is rendered in. |
| debug
| Integer
| Configures the flag for debug options for
the active report. Must be 1 or 0 (zero). |
config
| Object | Configuration object for controlling
the active report. An active report configuration object has the
following parameters which are specified as strings: - feed
Is the name of the iWay Enable feed which drives the active
report. This feed must be a dataset style JSON feed. - update
Is the time waiting (in seconds) between updates from the
feed. - name
Is the name of the type of report. For example, ActiveReport. - columnStyle
Is an optional column which overrides specification. This
provides an array of active report style-objects.
Note: Italicized
parameters are required. |
| customData
(Optional)
| Object
| Specifies the custom data
which generates the active report without requiring data from a
feed. The data must be a Javascript object in a dataset style.
|
x
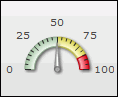
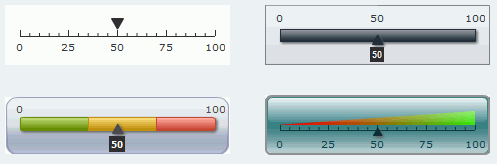
An angular gauge uses a radial scale to display a data
range, and a dial to indicate a data value. One variation of an
angular gauge is shown in the following image.
This API call creates an angular gauge. It is a subclas of Gauge.
iwenable.AngularGauge(ctxt,id,debug,config)
| Parameter
| Type
| Description
|
|---|
ctxt
| String | Specifies a relative or absolute path to
the iWay Service Manager. |
id
| String
| Specifies the HTML element ID to the element
that the gauge is rendered in. |
| debug
| Integer
| Configures the flag for
debug options for the angular gauge. Must be 1 or 0 (zero).
|
| config
| Object
| Configuration object for
controlling the angular gauge. The default size is 240 x 200 pixels.
|
The following methods are borrowed from the iwenable.Gauge class:
x
Use the following object for
advanced configuration of iWay Enable gauges and charts.
The any object is a generic class used to load a custom SWF file,
or an XML data file from a specified endpoint.
Note: Since the iwenable.ANY class is deprecated in iWay
Enable 1.1, using the specific gauge classes is recommended.
This API call creates an ANY object:
iwenable.ANY(swf,durl,id,debug,config)
Parameter
| Type
| Description |
|---|
swf
| String | Specifies the URL
for the Shockwave file. |
durl
| String | Specifies the URL for the XML file that
renders the object. |
id
| String | Specifies the ID of the HTML element that
will be rendered. |
debug
| Integer | Specifies whether or not to debug the object. |
config
| Object | Configures the iWay Enable object.
|
The following methods are borrowed from the iwenable.Gauge class:
x
The bar chart class provides integration with the iWay
Enable dataset feeds. Bar charts are displayed in two dimensions.
The dataset columns corresponds to the Y-axis of a bar chart and
the rows are displayed as different sets of data.
This API call creates a bar chart:
iwenable.BarChart(ctxt,id,config,config)
| Parameter
| Type
| Description
|
|---|
| ctxt
| String | Specifies a relative or
absolute path to the iWay Service Manager. |
id
| String | Specifies the HTML element ID to the element
that the bar chart is rendered in. |
config
| Object | Configuration object for controlling the
bar chart. A bar chart configuration object has the following parameters
which are specified as strings: - name
Is the name of the type of chart. For example, BarChart. - feed
Is the name of the iWay Enable feed which drives the chart.
This feed must be a JSON feed. - update
Is the time to wait (in seconds) between updates from the
feed. - font
Is the font face for the entire chart. - size
Is the font size for the entire chart. - palette
Is the text color in a hex code (without numbers). - background
Is the background color in a hex code (without numbers) - border
Is the option to create a border to the entire chart. Option
is true or false. - legend
Is the option to display the legend. Option is true or false. - width
Is the width of the chart in pixels. - height
Is the height of the chart in pixels.
Note: Italicized
parameters are required. |
The following method is borrowed from the iwenable.YuiChart class:
x
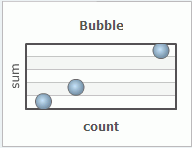
You can use bubble charts when you want to visualize
data. One variation of a bubble chart is shown in the following
image.
This API call creates a bubble chart:
iwenable.Bubble(ctxt, id, debug, config)
| Parameter
| Type
| Description
|
|---|
| ctxt
| String
| Specifies a relative or
absolute path to the iWay Service Manager. |
| id
| String
| Specifies the ID of the
HTML element that the chart is rendered in. |
| debug
| Integer
| Configures the flag for debug options for
the bubble chart. Must be 1 or 0 (zero). |
| config
| Object
| Configuration object for controlling the
bubble chart. |
x
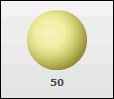
You can use bulb gauges when a single value or state
indicator is required. Colors can be selected to further enhance
the visualization.
One variation of a bulb gauge is shown in the following image.
This API call creates a bulb gauge:
iwenable.Bulb(ctxt,id,debug,config)
| Parameter
| Type
| Description
|
|---|
| ctxt
| String
| Specifies a relative or
absolute path to the iWay Service Manager. |
| id
| String
| Specifies the ID of the
HTML element that the gauge is rendered in. |
| debug
| Integer
| Configures the flag for
debug options for the bulb gauge. Must be 1 or 0 (zero).
|
| config
| Object
| Configuration object for
controlling the bulb gauge. The default size is 108 x 90 pixels.
|
The following methods are borrowed from the iwenable.Gauge class:
x
Chart superclass is the parent class for all fusion
widget charts. Charts are useful when you want to visualize data
and discover patterns or trends over time. Data streaming charts
are automatically updated in real-time.
Chart superclass provides basic fusion widget chart functionality
and extension for all charts. Charts work differently then gauges
in iWay Enable 1.1. Instead of making a call to the enable chart
service (which is still available for backward compatibility), in
iWay Enable 1.1, all fusion widget and fusion charts uses the document
transform tools found under iwenable to generate
the configuration XML, which is then directly fed into the Flash
object
The API call creates a chart:
iwenable.Chart(ctxt, id, debug)
| Parameter
| Type
| Description
|
|---|
| ctxt
| String
| Specifies a relative or
absolute path to the iWay Service Manager. |
| id
| String
| Specifies the ID of the
HTML element that the gauge is rendered in. |
| debug
| Integer
| Configures the flag for
debug options for charts. Must be 1 or 0 (zero).
|
The methods for charts is detailed below.
- render
Is the rendering function. This is used to create or recreate
the chart.
|
Parameter
|
Type
|
Description
|
|---|
durl
(Optional)
| String | Configures the durl formatted options to
override the configuration. |
- update
Changes or sets the configuration for the chart. If a chart
element was specified in the configuration object, its options are
merged into the options of the configuration object. The chart object
takes precedance.
|
Parameter
|
Type
|
Description
|
|---|
|
config
(Optional) | Object
| Specifies the configuration
object for charts. |
x
Column charts are charts that visualize two-dimensional
data with comparison of the parts. The visuals are arranged as horizontally
juxtaposed bars.
The column chart class provides integration with the iWay Enable
dataset feeds. The dataset columns correspond to the X axis of a
column chart. The rows are displayed as different sets of data.
In this case, as different bars laid out side by side.
|
Parameter
|
Type
|
Description
|
|---|
|
ctxt
|
String
|
Specifies a relative or absolute path to
the iWay Service Manager.
|
|
id
|
String
|
Specifies the HTML element
ID to the element that the chart is rendered in.
|
|
config
|
Object
|
Configuration object for controlling the
column chart. A column chart configuration object has the following
parameters which are specified as strings:
- name
-
Is the name of the type of a chart. For example, ColumnChart.
-
feed
-
Is the name of the iWay Enable feed which drives the chart.
This feed must be a JSON feed.
-
update
-
Is the time to wait (in seconds) between updates from the
feed.
- font
-
Is the font face for the entire chart.
- size
-
Is the font size for the entire chart.
- palette
-
Is the text color in a hex code (without numbers).
- background
-
Is the background color in a hex code (without numbers).
- border
-
Is the option to create a border to the entire chart. Option
is true or false.
- legend
-
Is the option to display the legend. Option is true or false.
- width
-
Is the width of the chart in pixels.
- height
-
Is the height of the chart in pixels.
Note: Italicized
parameters are required.
|
The following method is borrowed from the iwenable.YuiChart class:
x
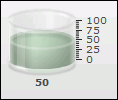
A cylinder gauge indicates containment within a well-defined
maximum and minimum value. Cylinder gauge is the gauge subclass
for creating cylinders. One variation of a cylinder gauge is shown
in the following image.
This API call creates a cylinder gauge. It is a subclass of gauge.
iwenable.Cylinder(ctxt,id,debug,config)
| Parameter
| Type
| Description
|
|---|
| ctxt
| String
| Specifies a relative or
absolute path to the iWay Service Manager. |
| id
| String
| Specifies the HTML element
ID to the element that the gauge is rendered in.
|
| debug
| Integer
| Configures the flag for
debug options for the cylinder gauge. Must be 1 or 0 (zero).
|
| config
| Object
| Specifies the configuration
object for controlling the iWay Enable cylinder gauge. Cylinder
has a default size of 144 x 180 pixels. |
The following methods are borrowed from the iwenable.Gauge class:
x
The YUI dataset chart superclass is the parent class
for the YUI line chart. It is a superclass to the dataset YUI trendline
chart superclass. The YUI dataset chart superclass provides more
detailed functionality for manipulating dataset axis for chart consumption.
Please refer to a specific chart object to create actual charts.
This API call creates a YUI dataset chart:
iwenable.DatasetYuiChart(ctxt, id, config)
| Parameter
| Type
| Description
|
|---|
| ctxt
| String
| Specifies a relative or
absolute path to the iWay Service Manager. |
| id
| String
| Specifies the HTML element
ID to the element that the chart is rendered in.
|
| config
| Object
| Specifies the configuration
object for controlling the chart. |
The following method is borrowed from the iwenable.YuiChart class:
x
Dataset YUI Trendline Chart
The YUI dataset trendline chart superclass is the parent
class for many YUI charts and provides more detailed functionality
for manipulating dataset series for chart consumption. Please refer
to a specific chart object to create actual charts.
This API call creates a YUI dataset trendline chart:
iwenable.DatasetYuiTrendlineChart(ctxt, id, config)
| Parameter
| Type
| Description
|
|---|
| ctxt
| String
| Specifies a relative or
absolute path to the iWay Service Manager. |
| id
| String
| Specifies the HTML element
ID to the element that the chart is rendered in.
|
| config
| Object
| Specifies the configuration
object for controlling the chart. |
The following method is borrowed from the iwenable.YuiChart class:
x
Data tables are basic grids that offers some styling,
but not much more beyond functionality. They present a nice simple
visualization for all dataset style feeds. One variation of a data
table grid is shown in the following image.
Data table grids wraps the YUI data table object and provides
integration with the iWay Enable dataset feeds.
This API call creates a data table grid:
iwenable.DataTable(ctxt, id, debug, config)
| Parameter
| Type
| Description
|
|---|
| ctxt
| String
| Specifies a relative or
absolute path to the iWay Service Manager. |
| id
| String
| Specifies the HTML element
ID to the element that the grid is rendered in.
|
|
debug
| Integer
| Configures
the flag for debug options for the data table grid. Must be 1 or
0 (zero). |
| config
| Object
| Configuration object for controlling the
data table. A data table grid configuration object has the following
parameters which are specified as strings: - feed
Is the name of the iWay Enable feed to drive the data table.
This feed must be a dataset style JSON feed. - update
Is the time to wait (in seconds) between updates from the
feed. - name
Is the name of the type of grid. For example, DataTable. - font
Is the font face for the entire data table grid. - size
Is the font size for the entire data table grid. This is
specified as a CSS size string, for example, 12 pt. - palette
Is the font color and specified as a hexadecimal string (without numbers). - background
Is the background color and specified as a hexadecimal string
(without numbers). - alt
Is the option to alternate row background colors. If true,
every other row will be white, otherwise, all rows are the background
color.
Note: Italicized parameters
are required. |
x
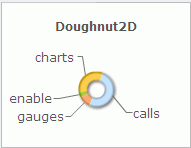
Doughtnut 2D charts are useful when you when you want
to visualize data and discover patterns or trends over time. Doughnut
2D charts extends fusion single series charts. One variation of
a doughnut 2D chart is shown in the following image.
This API call creates a doughnut 2D chart. It extends the iwenable.FusionSingleSeriesChart
class.
iwenable.Doughnut2D(ctxt,id,debug,config)
Parameter | Type
| Description |
|---|
ctxt
| String | Specifies a relative or absolute path to
the iWay Service Manager. |
id
| String | Specifies the HTML element ID to the element
that the chart is rendered in. |
debug
| String | Configures the flag for debug
options for the doughnut 2D chart. |
config
| Object | Specifies the configuration object for controlling
the chart. |
x
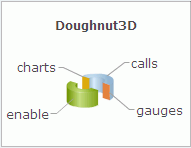
Doughtnut 3D charts are useful when you when you want
to visualize data and discover patterns or trends over time. Doughnut
3D charts extends fusion single series charts. One variation of
a doughnut 3D chart is shown in the following image.
This API call creates a doughnut 3D chart. It extends the iwenable.FusionSingleSeriesChart
class.
iwenable.Doughnut3D(ctxt,id,debug,config)
Parameter | Type
| Description |
|---|
ctxt
| String | Specifies a relative or absolute path to
the iWay Service Manager. |
id
| String | Specifies the HTML element ID to the element
that the chart is rendered in. |
debug
| String | Configures the flag for debug
options for the doughnut 3D chart. |
config
| Object | Specifies the configuration object for controlling
the chart. |
x
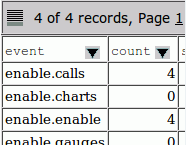
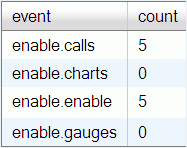
Event clouds display as one-dimensional grids. They
represent the data as differentially-sized labels. Event cloud grids
creates a word cloud populated with entries from an iWay Enable
JSON feed. The entries are typically event names, but can be anything.
Each label is sized according to the specified sizing algorithm.
One variation of an event cloud grid is shown in the following image.
This API call creates an event cloud grid:
iwenable.EventCloud(ctxt, id, debug, config)
Parameter | Type
| Description |
|---|
ctxt | String | Specifies a relative or absolute path to
the iWay Service Manager. |
id | String | Specifies the HTML element ID to the element
that the grid is rendered in. |
debug | String | Configures the flag for debug
options for the event cloud grid. Must be 1 or 0 (zero). |
config | Object | Specifies the configuration
object for controlling the cloud grid. A event cloud grid configuration
object has the following parameters which are specified as strings: - feed
Is the name of the iWay Enable feed to drive the cloud. This
feed must be a dataset style JSON feed. - update
Is the time to wait (in seconds) between updates from the
feed. - name
Is the name of the type of grid. For example, Cloud. - click
Is the base URI to load when individual events are clicked
on. The actual link is the name of the event appended to the end
of the base URI. - font
Is the font face for the entire cloud grid. - palette
Is the font color and specified as a hexadecimal string (without numbers). - background
Is the background color and specified as a hexadecimal string
(without numbers).
|
config (Continued) | Object (Continued) | - hilitecolor
Is the highlighted text color. HIghlights appear as events
change and is specified as a hexadecimal string (without numbers). - hiliteback
Is the highlighted background color. Highlights appear as
events change and is specified as a hexadecimal string (without numbers). - hovercolor
Is the hover text color. This displays when the mouse hovers
over an event and is specified as a hexadecimal string (without numbers). - showZero
Is the option to choose whether or not to display events
with zero count. - showbuttons
Is the option to choose whether or not to display roll-up
control buttons. In roll-up mode, the cloud grid will only display
the top-level events. Clicking on them will drill-down into subevents. - sizealg
Is the option to choose which size algorithm to employ in
determining label size. This can be linear or logarithmic. The minimum
font size is 10 pixels and the maximum font size is 50 pixels.
Note: Italicized
parameters are required. |
x
Fusion charts superclass provides basic fusion chart
funtionality for all charts to extend. Fusion charts work differently
than the fusion widget charts, in that, they do not have native
real-time update functionality. The iWay Enable integration layer
provides functionality for integration with iWay Enable dataset
feeds. Otherwise, fusion charts work similiarly to fusion widget
charts.
This API call creates a fusion chart. It is a subclass of Chart.
iwenable.FusionCharts(ctxt, id, debug, config)
Parameter | Type
| Description |
|---|
ctxt | String | Specifies a relative or absolute path to
the iWay Service Manager. |
id | String | Specifies the HTML element ID to the element
that the gauge is rendered in. |
debug | String | Configures the flag for debug
options for fusion charts. Must be 1 or 0 (zero). |
config | Object | Specifies the configuration
object for controlling fusion charts. A fusion chart configuration
object has the following parameters which are specified as strings: - name
Is the name of the type of chart. - feed
Is the name of the iWay Enable feed to drive the chart. This
feed must be a JSON feed. - update
Is the time to wait (in seconds) between updates from the
feed. - click
Is the URI to load when the chart is clicked on. - caption
Is the text label for the chart caption. - subCaption
Is the text label for the chart subcaption. - palette
Is the color theme base color as a hex code (without numbers). - background
Is the background color as a hex code (without numbers).
|
config (Continued) | Object (Continued) | - font
Is the font face for the entire chart. - size
Is the font size for the entire chart. - border
Is the option to choose whether or not to render a border
on the entire chart. Options are true or false. - rotation
Is the option to choose whether or not to allow rotating
behavior. Options are true or false. - values
Is the option to choose whether or not to display the current
data value. Options are true or false. - width
Is the width of the chart in pixels. - height
Is the height of the chart in pixels.
Note: Italicized
parameters are required. |
x
Fusion Single Series Charts
Fusion single series chart is a superclass and extends
the iwenable.FusionCharts class.
|
Parameter
|
Type
|
Description
|
|---|
|
ctxt
|
String
|
Specifies a relative or absolute path to
the iWay Service Manager.
|
|
id
|
String
|
Specifies the HTML element ID to the element
that the chart is rendered in.
|
|
debug
|
String
|
Configures the flag for debug
options for the fusion single series chart.
|
|
config
|
Object
|
Specifies the configuration object for controlling
the chart.
|
x
Gauge superclass is the parent class for all fusion
widget gauges and provides functionality for all gauges to extend.
Gauges are useful when you are interested in the current value of
a monitored item. Gauges typically displays a single value as it
falls within a range. This value can be updated in real-time.
Gauges converts the configuration object into a DURL format string,
which is then fed to the service of the enable.gauge. The returned
XML document is then used to drive the gauge.
This API call creates a gauge:
iwenable.Gauge(ctxt,id,debug,config)
Parameter | Type | Description |
|---|
ctxt
| String | Specifies a relative or absolute path to
the iWay Service Manager. |
id
| String | Specifies the ID of the HTML element that
the gauge is rendered in. |
debug
| Integer | Configures the flag for debug
options for gauges. Must be 1 or 0 (zero). |
config | Object | Specifies the configuration
object for controlling the gauge. A typical gauge configuration
object has the following parameters, which are specified as strings: - name
Is the name of the type of gauge. For example, AngularGauge,
Bulb, Cylinder, and so on. - type
Is the subtype of the gauge. - feed
Is the name of the iWay Enable feed to drive the gauge. This
feed must be a default type and return a CGI style result. - update
Is the time to wait (in seconds) between updates from the
feed. - click
Is the URI to load when the gauge is clicked on. - value
Is the initial value to display. - lowerlimit
Is the lower bound of the gauge display. Default is 0. - upper limit
Is the upper bound of the gauge display. Default is 100. - label
Is a text label for the title.
|
config (Continued) | Object | - palette
Is the color theme base color as a hex code (without numbers). - background
Is the background color as a hex code (without numbers). - border
Provides the option to choose whether or not to render a
border on the entire gauge. Options are true or false. - size
Provides the option to autosize the chart. Sizes can be small,
medium, or large. - width
Is the width of the gauge in pixels. - height
Is a height of the gauge in pixels. - style
Is a custom chart with XML styles.
Note: Italicized
parameters are required. |
The methods for gauge is detailed below.
- render
Is the rendering function. This creates or recreates the
gauge.
Parameter | Type | Description |
|---|
durl
(Optional) | String | Specifies the DURL formatted options to
override the configuration. |
- update
Sets the configuration object for the gauge.
Parameter | Type | Description |
|---|
config
(Optional) | Object | Is the configuration object which replaces
the exiting object specified in the constructor. |
x
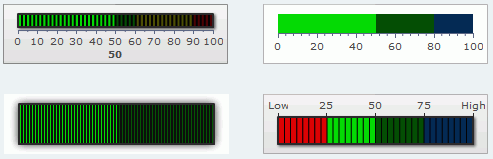
Gauges typically displays a single value as it falls
within a range. This value can be updated in real time. Several
variations of Horizontal LED gauges are shown in the following image.
This API call creates a Horizontal LED gauge. It is a subclass
of Gauge.
iwenable.HLED(ctxt,id,debug,config)
Parameter | Type
| Description |
|---|
ctxt
| String | Specifies the relative or absolute path
to the iWay Service Manager. |
id
| String | Specifies the HTML element ID to the elemet
that the gauge is rendered in. |
debug
| Integer | Configures the flag for debug options for
gauges. Must be 1 or 0 (zero). |
config
| Object | Specifies the configuration object for controlling
the gauge. Horizontal LED gauge has a default size of 336 x 90 pixels. |
The following methods are borrowed from the iwenable.Gauge class:
x
A horizontal linear gauge indicates progression of a
single value. Several variations of horizontal linear gauges are
shown in the following image.
This API call creates a horizontal linear gauge. It is a subclass
of Gauge.
iwenable.HLinearGauge(ctxt,id,debug,config)
Parameter | Type
| Description |
|---|
ctxt
| String | Specifies the relative or absolute path
to the iWay Service Manager. |
id
| String | Specifies the HTML element ID to the elemet
that the gauge is rendered in. |
debug
| Integer | Configures the flag for debug options for
gauges. Must be 1 or 0 (zero). |
config
| Object | Specifies the configuration object for controlling
the gauge. Horizontal Linear gauge has a default size of 336 x 90
pixels. |
The following methods are borrowed from the iwenable.Gauge class:
x
Line charts are charts that visualize two-dimensional
data as progressions. Line chart class provides integration with
the iWay Enable dataset feeds. Data is displayed as lines progress
across the X axis. The dataset columns corresponds to the X axis
of a line chart. The rows are displayed as different sets of data.
In this case, as different lines.
This API call creates a line chart. It extends the iwenable.DatasetYuiChart
class.
iwenable.LineChart(ctxt, id, config, config)
Parameter | Type
| Description |
|---|
ctxt
| String | Specifies the relative or absolute path
to the iWay Service Manager. |
id
| String | Specifies the HTML element ID to the elemet
that the chart is rendered in. |
config
| Object | Specifies the configuration object for controlling
the chart. A line chart configuration object has the following parameters,
which are specified as strings: - name
Is the name of the type of chart. For example, LineChart. - feed
Is the name of the iWay Enable feed which drives the chart.
This feed must be a JSON feed. - update
Is the time to wait (in seconds) between updates from the
feed. - font
Is the font face for the entire chart. - size
Is the font size for the entire chart. - palette
Is the text color as a hex code (without numbers). - background
Is the background color as a hex code (without numbers). - border
Provides the option to choose whether or not to render a
border on the entire chart. Options are true or false. - legend
Provides the option to choose whether or not to display the
legend. Options are true or false. - width
Is the width of the chart in pixels. - height
Is a height of the chart in pixels.
Note: Italicized
parameters are required. |
The following method is borrowed from the iwenable.YuiChart class:
x
Pie chart class provides integration with the iWay Enable
dataset feeds. Pie charts are charts that visualize one-dimensional
data with respect to proportions of the whole and takes only the
value of the first data column. The visuals are arranged as slices of
a circular pie. Hence, the dataset feed used to drive it only needs
to have a one data column.
This API call creates a pie chart. It extends the iwenable.YuiChart
class.
iwenable.PieChart(ctxt, id, config, config)
Parameter | Type | Description |
|---|
ctxt
| String | Specifies the relative or absolute path
to the iWay Service Manager. |
id
| String | Specifies the HTML element ID to the element
that the chart is rendered in. |
config
| Object | Specifies the configuration object for controlling
the chart. A pie chart configuration object has the following parameters,
which are specified as strings: - name
Is the name of the type of chart. For example, PieChart. - feed
Is the name of the iWay Enable feed which drives the chart.
This feed must be a JSON feed. - update
Is the time to wait (in seconds) between updates from the
feed. - font
Is the font face for the entire chart. - size
Is the font size for the entire chart. - palette
Is the text color as a hex code (without numbers). - background
Is the background color as a hex code (without numbers). - border
Provides the option to choose whether or not to render a
border on the entire chart. Options are true or false. - legend
Provides the option to choose whether or not to display the
legend. Options are true or false. - width
Is the width of the chart in pixels. - height
Is a height of the chart in pixels.
Note: Italicized
parameters are required. |
The following method is borrowed from the iwenable.YuiChart class:
x
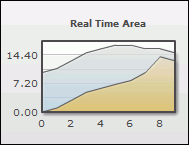
A real time area chart is similar to a line chart except
that the area between the data line and axis is usually displayed
in color. A real time area chart is shown in the following image.
This API call creates a real time area chart. It is a subclass
of charts and extends the iwenable.Chart class.
iwenable.RealTimeArea(ctxt,id,debug,config)
Parameter | Type | Description |
|---|
ctxt
| String | Specifies the relative or absolute path
to the iWay Service Manager. |
id
| String | Specifies the HTML element ID to the element
that the chart is rendered in. |
debug
| Integer | Configures the flag for debug options for
charts. Must be 1 or 0 (zero). |
config | Object | Specifies the configuration object for controlling
the chart. A real time area chart configuration object has the following parameters,
which are specified as strings: - name
Is the name of the type of chart. For example, RealTimeArea. - type
Is the type of data used to drive the chart. This can be
historical or specified. - Historical data. Makes
use of key, action, history and numDisplaySets options.
- Specified data. Requires a JSON feed.
- feed
Is the name of the iWay Enable feed which drives the chart.
This feed can be a default type CGI style or a JSON feed, depending
on the type of chart. - update
Is the time to wait (in seconds) between updates from the
feed. - click
Is the URI to load when the chart is clicked on. - key
Is the event to display. You can specify a list of events
as a pipe-separated ( | ) string. - action
Is the aggregation action to apply to the key events. - history
Is the amount of time to aggregate over. This is specified
in milliseconds. - numDisplaySets
Is the range of data to display on the X axis.
|
config (Continued) | Object (Continued) | - caption
Is a text label for the chart caption. - subCaption
Is a text label for the chart subcaption. - xAxisName
Is a text label for the X axis. - yAxisName
Is a text label for the Y axis. - palette
Is the color theme base color as a hex code (without numbers). - background
Is the background color as a hex code (without numbers). - border
Is the option to choose whether or not to render a border
on the entire chart. Option is true or false. - anchor
Is the option to choose whether or not to display individual
data points. Option is true or false. - legend
Is the option to choose whether or not to display the legend.
Option is true or false. - values
Is the option to choose whether or not to display the current
data value. Option is true or false. - size
Is the option to autosize the chart. Sizes can be small,
medium, or large. - width
Is the width of the chart in pixels. - height
Is the height of the chart in pixels.
|
config (Continued) | Object (Continued) | - style
Is the custom chart XML styles.
Note: Italicized
parameters are required. |
The following methods are borrowed from the iwenable.Chart class:
x
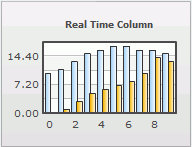
A real time column chart plots numerical data by displaying
rectangular blocks against a scale that appears along the axis.
The length of a column corresponds to a value or amount. A real
time column chart is shown in the following image.
This API call creates a real time column chart. It is a subclass
of charts and extends the iwenable.Chart class.
iwenable.RealTimeColumn(ctxt, id, debug, config)
Parameter | Type | Description |
|---|
ctxt
| String | Specifies the relative or absolute path
to the iWay Service Manager. |
id
| String | Specifies the HTML element ID to the element
that the chart is rendered in. |
debug
| Integer | Configures the flag for debug options for
charts. Must be 1 or 0 (zero). |
config | Object | Specifies the configuration object for controlling
the chart. A real time column chart configuration object has the
following parameters, which are specified as strings: - name
Is the name of the type of chart. For example, RealTimeColumn. - type
Is the type of data used to drive the chart. This can be
historical or specified. - Historical data. Makes
use of key, action, history, and numDisplaySets options.
- Specified data. Requires a JSON feed.
- feed
Is the name of the iWay Enable feed which drives the chart.
This feed can be a default type CGI style or a JSON feed, depending
on the type of chart. - update
Is the time to wait (in seconds) between updates from the
feed. - click
Is the URI to load when the chart is clicked on. - key
Is the event to display. You can specify a list of events
as a pipe-separated ( | ) string. - action
Is the aggregation action to apply to the key events. - history
Is the amount of time to aggregate over. This is specified
in milliseconds. - numDisplaySets
Is the range of data to display on the X axis.
|
config (Continued) | Object (Continued) | - caption
Is a text label for the chart caption. - subCaption
Is a text label for the chart subcaption. - xAxisName
Is a text label for the X axis. - yAxisName
Is a text label for the Y axis. - palette
Is the color theme base color as a hex code (without numbers). - background
Is the background color as a hex code (without numbers). - border
Is the option to choose whether or not to render a border
on the entire chart. Option is true or false. - anchor
Is the option to choose whether or not to display individual
data points. Option is true or false. - legend
Is the option to choose whether or not to display the legend.
Option is true or false. - values
Is the option to choose whether or not to display the current
data value. Option is true or false. - size
Is the option to autosize the chart. Sizes can be small,
medium, or large. - width
Is the width of the chart in pixels.
|
config (Continued) | Object (Continued) | - height
Is the height of the chart in pixels. - style
Is the custom chart XML styles.
Note: Italicized
parameters are required. |
The following methods are borrowed from the iwenable.Chart class:
x
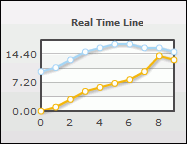
A real time line chart reveals the movement or trend
of numerical data over time. A real time line chart is shown in
the following image.
This API call creates a real time line chart. It is a subclass
of charts and extends the iwenable.Chart class.
iwenable.RealTimeLine(ctxt,id,debug,config)
Parameter | Type | Description |
|---|
ctxt
| String | Specifies the relative or absolute path
to the iWay Service Manager. |
id
| String | Specifies the HTML element ID to the element
that the chart is rendered in. |
debug
| Integer | Configures the flag for debug options for
charts. Must be 1 or 0 (zero). |
config | Object | Specifies the configuration object for controlling
the chart. A real time line chart configuration object has the following parameters,
which are specified as strings: - name
Is the name of the type of chart. For example, RealTimeLine. - type
Is the type of data used to drive the chart. This can be
historical or specified. - Historical data. Makes
use of key, action, history, and numDisplaySets options.
- Specified data. Requires a JSON feed.
- feed
Is the name of the iWay Enable feed which drives the chart.
This feed can be a default type CGI style or a JSON feed, depending
on the type of chart. - update
Is the time to wait (in seconds) between updates from the
feed. - click
Is the URI to load when the chart is clicked on. - key
Is the event to display. You can specify a list of events
as a pipe-separated ( | ) string. - action
Is the aggregation action to apply to the key events. - history
Is the amount of time to aggregate over. This is specified
in milliseconds. - numDisplaySets
Is the range of data to display on the X axis.
|
config (Continued) | Object (Continued) | - caption
Is a text label for the chart caption. - subCaption
Is a text label for the chart subcaption. - xAxisName
Is a text label for the X axis. - yAxisName
Is a text label for the Y axis. - palette
Is the color theme base color as a hex code (without numbers). - background
Is the background color as a hex code (without numbers). - border
Is the option to choose whether or not to render a border
on the entire chart. Option is true or false. - anchor
Is the option to choose whether or not to display individual
data points. Option is true or false. - legend
Is the option to choose whether or not to display the legend.
Option is true or false. - values
Is the option to choose whether or not to display the current
data value. Option is true or false. - size
Is the option to autosize the chart. Sizes can be small,
medium, or large. - width
Is the width of the chart in pixels. - height
Is the height of the chart in pixels.
|
config (Continued) | Object (Continued) | - style
Is the custom chart XML styles. - chart
Is the Javascript object containing custom configuration
for fusion widget charts.
Note: Italicized
parameters are required. |
The following methods are borrowed from the iwenable.Chart class:
x
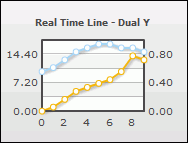
Real Time Line Dual Y Chart
A real time line dual Y chart has two vertical axes.
A real time line dual Y chart is shown in the following image.
This API call creates a real time line dual Y chart. It is a
subclass of charts.
iwenable.RealTimeLineDY(ctxt,id,debug,config)
Parameter | Type | Description |
|---|
ctxt
| String | Specifies the relative or absolute path
to the iWay Service Manager. |
id
| String | Specifies the HTML element ID to the element
that the chart is rendered in. |
debug
| Integer | Configures the flag for debug options for
charts. Must be 1 or 0 (zero). |
config | Object | Specifies the configuration object for controlling
the chart. A real time line dual Y chart configuration object has
the following parameters, which are specified as strings: - name
Is the name of the type of chart. For example, RealTimeLineDY. - type
Is the type of data used to drive the chart. This can be
historical or specified. - Historical data. Makes
use of key, action, history, and numDisplaySets options.
- Specified data. Requires a JSON feed.
- feed
Is the name of the iWay Enable feed which drives the chart.
This feed can be a default type CGI style or a JSON feed, depending
on the type of chart. - update
Is the time to wait (in seconds) between updates from the
feed. - click
Is the URI to load when the chart is clicked on. - key
Is the event to display. You can specify a list of events
as a pipe-separated ( | ) string. - action
Is the aggregation action to apply to the key events. - history
Is the amount of time to aggregate over. This is specified
in milliseconds. - numDisplaySets
Is the range of data to display on the X axis.
|
config (Continued) | Object (Continued) | - lowerlimit
Is the lower bound for the secondary Y axis scale. - upperlimit
Is the upper bound for the secondary Y axis scale. - caption
Is a text label for the chart caption. - subCaption
Is a text label for the chart subcaption. - xAxisName
Is a text label for the X axis. - yAxisName
Is a text label for the Y axis. - syAxisName
Is a text label for the secondary Y axis. - palette
Is the color theme base color as a hex code (without numbers). - background
Is the background color as a hex code (without numbers). - border
Is the option to choose whether or not to render a border
on the entire chart. Option is true or false. - anchor
Is the option to choose whether or not to display individual
data points. Option is true or false. - legend
Is the option to choose whether or not to display the legend.
Option is true or false. - values
Is the option to choose whether or not to display the current
data value. Option is true or false.
|
config (Continued) | Object (Continued) | - size
Is the option to autosize the chart. Sizes can be small,
medium, or large. - width
Is the width of the chart in pixels. - height
Is the height of the chart in pixels. - style
Is the custom chart XML styles.
Note: Italicized
parameters are required. |
The following methods are borrowed from the iwenable.Chart class:
x
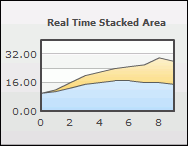
Real Time Stacked Area Chart
A real time stacked area chart is shown in the following
image.
This API call creates a real-time stacked area chart. It is a
subclass of charts.
iwenable.RealTimeStackedArea(ctxt,id,debug,config)
Parameter | Type | Description |
|---|
ctxt
| String | Specifies the relative or absolute path
to the iWay Service Manager. |
id
| String | Specifies the HTML element ID to the element
that the chart is rendered in. |
debug
| Integer | Configures the flag for debug options for
charts. Must be 1 or 0 (zero). |
config | Object | Specifies the configuration object for controlling
the chart. A real time stacked area chart configuration object has
the following parameters, which are specified as strings: - name
Is the name of the type of chart. For example, RealTimeStackedArea. - type
Is the type of data used to drive the chart. This can be
historical or specified. - Historical data. Makes
use of key, action, history, and numDisplaySets options.
- Specified data. Requires a JSON feed.
- feed
Is the name of the iWay Enable feed which drives the chart.
This feed can be a default type CGI style or a JSON feed, depending
on the type of chart. - update
Is the time to wait (in seconds) between updates from the
feed. - click
Is the URI to load when the chart is clicked on. - key
Is the event to display. You can specify a list of events
as a pipe-separated ( | ) string. - action
Is the aggregation action to apply to the key events. - history
Is the amount of time to aggregate over. This is specified
in milliseconds. - numDisplaySets
Is the range of data to display on the X axis.
|
config (Continued) | Object (Continued) | - caption
Is a text label for the chart caption. - subCaption
Is a text label for the chart subcaption. - xAxisName
Is a text label for the X axis. - yAxisName
Is a text label for the Y axis. - palette
Is the color theme base color as a hex code (without numbers). - background
Is the background color as a hex code (without numbers). - border
Is the option to choose whether or not to render a border
on the entire chart. Option is true or false. - anchor
Is the option to choose whether or not to display individual
data points. Option is true or false. - legend
Is the option to choose whether or not to display the legend.
Option is true or false. - values
Is the option to choose whether or not to display the current
data value. Option is true or false. - size
Is the option to autosize the chart. Sizes can be small,
medium, or large. - width
Is the width of the chart in pixels. - height
Is the height of the chart in pixels.
|
config (Continued) | Object (Continued) | - style
Is the custom chart XML styles.
Note: Italicized
parameters are required. |
The following methods are borrowed from the iwenable.Chart class:
x
Real Time Stacked Column Chart
A real time stacked column chart displays stacked groups
of columns. A real time stacked column chart is shown in the following
image.
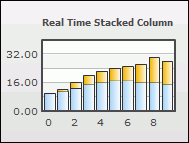
This API call creates a real-time stacked column chart. It is
a subclass of charts.
iwenable.RealTimeStackedColumn(ctxt,id,debug,config)
Parameter | Type | Description |
|---|
ctxt
| String | Specifies the relative or absolute path
to the iWay Service Manager. |
id
| String | Specifies the HTML element ID to the element
that the chart is rendered in. |
debug
| Integer | Configures the flag for debug options for
charts. Must be 1 or 0 (zero). |
config | Object | Specifies the configuration object for controlling
the chart. A real time stacked column chart configuration object
has the following parameters, which are specified as strings: - name
Is the name of the type of chart. For example, RealTimeStackedColumn. - type
Is the type of data used to drive the chart. This can be
historical or specified. - Historical data. Makes
use of key, action, history, and numDisplaySets options.
- Specified data. Requires a JSON feed.
- feed
Is the name of the iWay Enable feed which drives the chart.
This feed can be a default type CGI style or a JSON feed, depending
on the type of chart. - update
Is the time to wait (in seconds) between updates from the
feed. - click
Is the URI to load when the chart is clicked on. - key
Is the event to display. You can specify a list of events
as a pipe-separated ( | ) string. - action
Is the aggregation action to apply to the key events. - history
Is the amount of time to aggregate over. This is specified
in milliseconds. - numDisplaySets
Is the range of data to display on the X axis.
|
config (Continued) | Object (Continued) | - caption
Is a text label for the chart caption. - subCaption
Is a text label for the chart subcaption. - xAxisName
Is a text label for the X axis. - yAxisName
Is a text label for the Y axis. - palette
Is the color theme base color as a hex code (without numbers). - background
Is the background color as a hex code (without numbers). - border
Is the option to choose whether or not to render a border
on the entire chart. Option is true or false. - anchor
Is the option to choose whether or not to display individual
data points. Option is true or false. - legend
Is the option to choose whether or not to display the legend.
Option is true or false. - values
Is the option to choose whether or not to display the current
data value. Option is true or false. - size
Is the option to autosize the chart. Sizes can be small,
medium, or large. - width
Is the width of the chart in pixels. - height
Is the height of the chart in pixels.
|
config (Continued) | Object (Continued) | - style
Is the custom chart XML styles.
Note: Italicized
parameters are required. |
The following methods are borrowed from the iwenable.Chart class:
x
Stacked bar charts are charts that visualize two-dimensional
data with regards to proportion to the whole. The visuals are arranged
as horizontally stacked bars.
Stacked bar charts provides integration with the iWay Enable
dataset feeds. The dataset columns corresponds to the Y axis of
a stacked bar chart. The rows are displayed as different sets of
data. In this case, as different bars stacked left to right.
This API call creates a stacked bar chart:
iwenable.StackedBarChart(ctxt,id,config,config)
Parameter | Type | Description |
|---|
ctxt
| String | Specifies the relative or absolute path
to the iWay Service Manager. |
id
| String | Specifies the HTML element ID to the element
that the chart is rendered in. |
config | Object | Specifies the configuration object for controlling
the chart. A stacked bar chart configuration object has the following parameters,
which are specified as strings: - name
Is the name of the type of chart. For example, StackedBarChart. - feed
Is the name of the iWay Enable feed which drives the chart.
This feed must be a JSON feed. - update
Is the time to wait (in seconds) between updates from the
feed. - font
Is the Font face for the entire chart. - size
Is the font size for the entire chart. - palette
Is the text color as a hex code (without numbers). - background
Is the background color as a hex code (without numbers). - border
Is the option to choose whether or not to render a border
on the entire chart. Option is true or false. - legend
Is the option to choose whether or not to display the legend.
Option is true or false. - width
Is the width of the chart in pixels. - height
Is the height of the chart in pixels.
Note: Italicized
parameters are required. |
The following method is borrowed from the iwenable.YuiChart class:
x
Stacked column charts are charts that visualize two-dimensional
data with regards to proportion to the whole. The visuals are arranged
as vertically stacked bars.
Stacked column charts provides integration with iWay Enable dataset
feeds. The dataset columns corresponds to the Y axis of a stacked
column chart. The rows are displayed as different sets of data.
In this case, as different bars stacked on top of each other.
This API call creates a stacked column chart:
iwenable.StackedColumnChart(ctxt,id,config,config)
Parameter | Type | Description |
|---|
ctxt
| String | Specifies the relative or absolute path
to the iWay Service Manager. |
id
| String | Specifies the HTML element ID to the element
that the chart is rendered in. |
config | Object | Specifies the configuration object for controlling
the chart. A stacked column chart configuration object has the following parameters,
which are specified as strings: - name
Is the name of the type of chart. For example, StackedColumnChart. - feed
Is the name of the iWay Enable feed which drives the chart.
This feed must be a JSON feed. - update
Is the time to wait (in seconds) between updates from the
feed. - font
Is the Font face for the entire chart. - size
Is the font size for the entire chart. - palette
Is the text color as a hex code (without numbers). - background
Is the background color as a hex code (without numbers). - border
Is the option to choose whether or not to render a border
on the entire chart. Option is true or false. - legend
Is the option to choose whether or not to display the legend.
Option is true or false. - width
Is the width of the chart in pixels. - height
Is the height of the chart in pixels.
Note: Italicized
parameters are required. |
The following method is borrowed from the iwenable.YuiChart class:
x
A thermometer gauge indicates the current position of
a single data value within a given range of values. One variation
of a thermometer gauge is shown in the following image.
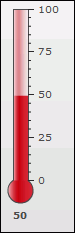
This API call creates a thermometer gauge. It is a subclass of
gauge.
iwenable.Thermometer(ctxt,id,debug,config)
Parameter | Type | Description |
|---|
ctxt
| String | Specifies the relative or absolute path
to the iWay Service Manager. |
id
| String | Specifies the HTML element ID to the element
that the gauge is rendered in. |
debug | Integer | Configures the flag for debug options for
the thermometer gauge. Must be 1 or 0 (zero). |
config | Object | Specifies the configuration object for controlling
the gauge. Thermometer has a default size of 80 x 216 pixels. |
The following methods are borrowed from the iwenable.Gauge class:
x
One variation of a vertical LED gauge is shown in the
following image.
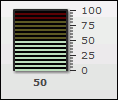
This API call creates a vertical LED gauge. Vertical LED is a
subclass of Gauge.
iwenable.VLED(ctxt,id,debug,config)
Parameter | Type | Description |
|---|
ctxt
| String | Specifies the relative or absolute path
to the iWay Service Manager. |
id
| String | Specifies the HTML element ID to the element
that the gauge is rendered in. |
debug | Integer | Configures the flag for debug options for
the vertical LED gauge. Must be 1 or 0 (zero). |
config | Object | Specifies the configuration object for controlling
the gauge. Vertical LED has a default size of 80 x 216 pixels. |
The following methods are borrowed from the iwenable.Gauge class:
x
XY plot charts is a superclass and extends the iwenable.FusionChart class.
This API call creates an XY plot chart:
iwenable.XYPlotCharts(ctxt,id,debug,config)
Parameter | Type | Description |
|---|
ctxt
| String | Specifies the relative or absolute path
to the iWay Service Manager. |
id
| String | Specifies the HTML element ID to the element
that the chart is rendered in. |
debug | Integer | Configures the flag for debug options for
the XY plot chart. |
config | Object | Specifies the configuration object for controlling
the chart. |
x
YUI chart superclass is the parent class for all YUI
charts. This is a superclass to the iwenable.DatasetYuiChart class.
Refer to a specific chart object in order to create an actual chart.
YUI charts superclass provides a basic YUI chart functionality
for all such charts to extend. YUI charts creates a YUI data source
object from the data which is returned by an iWay Enable feed. That
object is then used to drive the indivudual YUI chart.
This API call creates a YUI chart:
iwenable.YuiChart(ctxt,id,config)
Parameter | Type | Description |
|---|
ctxt
| String | Specifies the relative or absolute path
to the iWay Service Manager. |
id
| String | Specifies the HTML element ID to the element
that the chart is rendered in. |
config | Object | Specifies the configuration object for controlling
the chart. |
The method for YUI chart is detailed below.
- render
Is an empty function on YUI chart objects. They will render
as soon as the constructor is called.