To enable and view feeds:
-
Click Tools in the top pane of the iWay Service
Manager Administration Console.

The iWay Service Manager Tools pane opens.
-
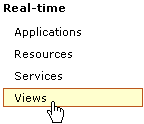
In the left pane, select Views under
the Real-time section.
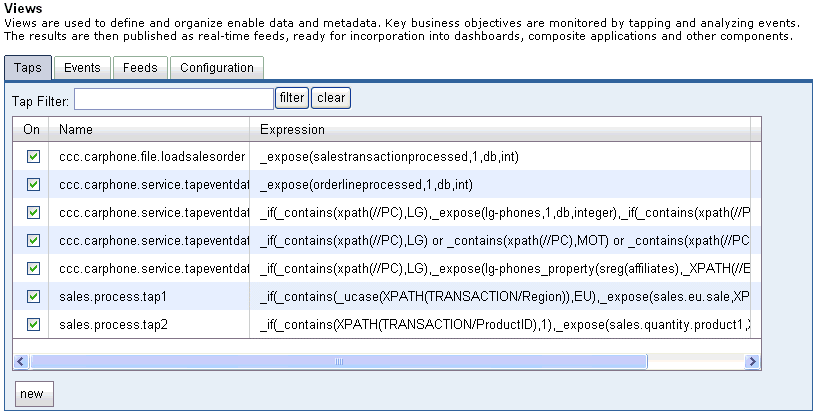
The Views pane opens, as shown in the following image.
-
Click the Feeds tab.
The Feeds tab opens, as shown in the following image.

You can view the available feeds, including the two feeds that were automatically generated during the configuration of the iWay Enable sample application (enable.sales.product.graph and enable.sales.total.graph). The naming convention used by automatically generated feeds is
enable.PortletNamewhere:
- PortletName
Is the name of the portlet.
In the Usage column, the expression used by a feed can also be viewed. For example, you can see that the enable.sales.total.graph feed, which is used by the TotalSalesGraph portlet, is an update of the summation for the sales.eu.sale and sales.us.sale events within a one-minute interval.
-
Right-click an available feed (for example, enable.sales.total.graph)
and select View feed from the context menu.
The enable.sales.total.graph window opens and displays the current data in real time, which is represented by the feed information.
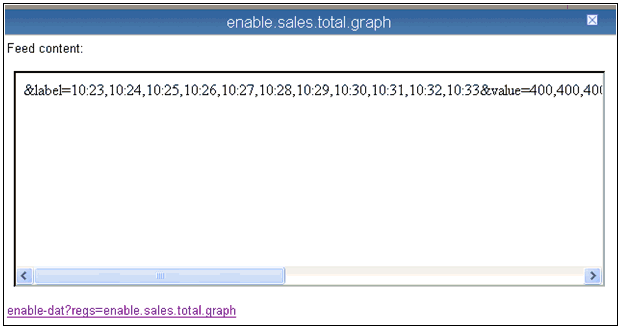
The URL representation for this feed can be used by any external application to access real-time data being captured by this process.
The following is a sample URL for the enable.sales.total.graph feed, which was created by the TotalSalesGraph portlet:
http://localhost:9999/ism/enable-dat?regs=enable.sales.total.graph

The above feed represents the label parameter, which contains values for the x-axis timeline and the value parameter, which represents the corresponding data for the two monitored events. This string can be parsed by a Web application and updated with each URL request as a result.
As feeds are represented as registers within the system, they can also be views under the Registers section of the iSM Console.
-
Click Registry in the top pane of the
iWay Service Manager Administration Console.

The iWay Service Manager Registry pane opens.

-
In the left pane, select Registers under
the Variables section.
The Registers pane opens, as shown in the following image.
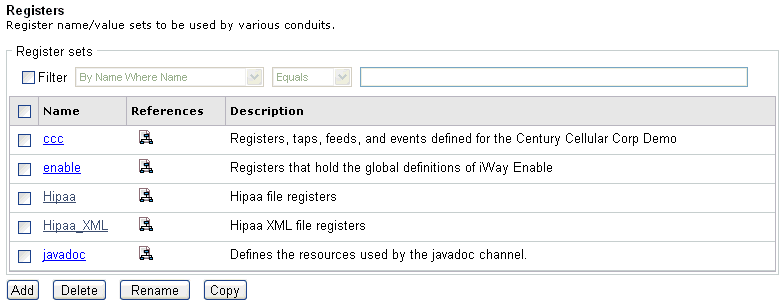
The table that is provided lists any existing register sets and a short description for each.
-
Click the enable register set link.
The Registers / enable pane opens.
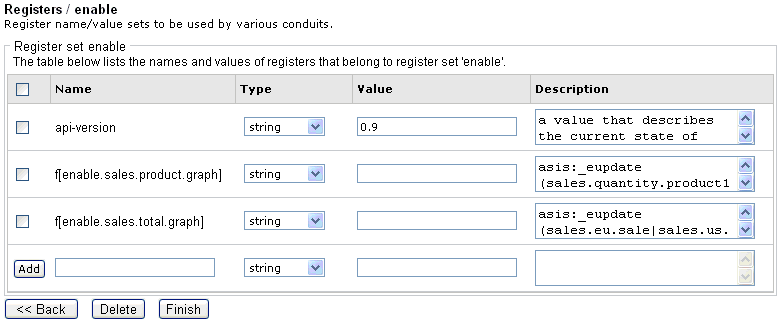
All the feeds that were automatically generated are stored within the enable register set. The f[] annotation for the generated feeds indicates that this register is used as a feed. For example:
f[enable.sales.product.graph]
f[enable.sales.total.graph]