Manage Data Quality Indicators
The following sections describe the various Quality
Indicators available in the iWay Data Profiler.
x
DQI computes the failure and success rate for each input
row and outputs the result together with the input rows. This tab
displays the created DQIs and allows you to create, edit, and delete
DQIs.
x
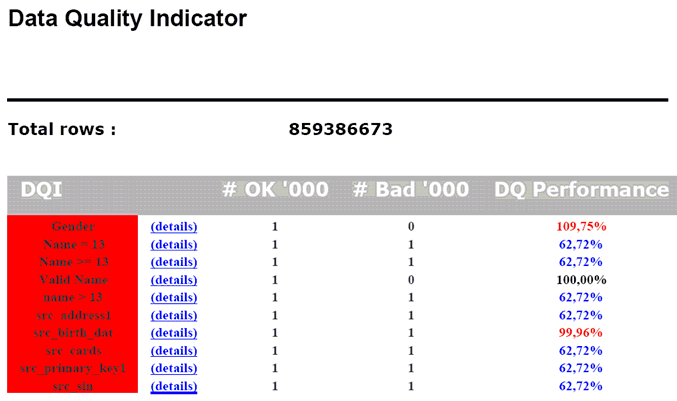
Display Data Quality Indicators
Click on Manage Data Quality Indicators in
the Home page. The Display Data Quality Indicators screen opens,
as shown in the following image.
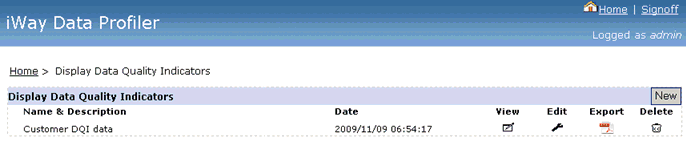
It includes:
- Data Quality Indicator name and description.
- Date and time the DQI was created.
- An icon to view the Data Quality Indicator.
- An icon to edit the Data Quality Indicator.
- An icon to display the data profile in PDF format.
- An icon to delete the Data Quality Indicator.
- A New button to create a new Data Quality Indicator.
x
Create New Data Quality Indicator
Click the New button in the Display
Data Quality Indicators screen. The New DQI screen
opens, as shown in the following image.
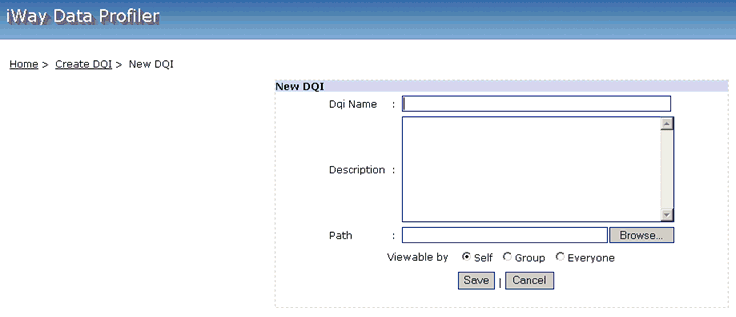
The fields required to create a new data profile are:
- DQI Name.
- Description.
- Path of the txt file which has been generated by DQC.
- One of the three viewable options (for example, Self, Group,
or Everyone).
Note:
If you select the Self option,
the profile can be viewed only by the creator.
If you select
the Group option, the profile can be viewed by all the users of
the group to which the creator belongs.
If you select the
Everyone option, the profile can be viewed by everyone.
x
Edit Data Quality Indicator
Click the Edit icon in the Display
Data Quality Indicators screen. The Edit Profile screen opens, as
shown in the following image.
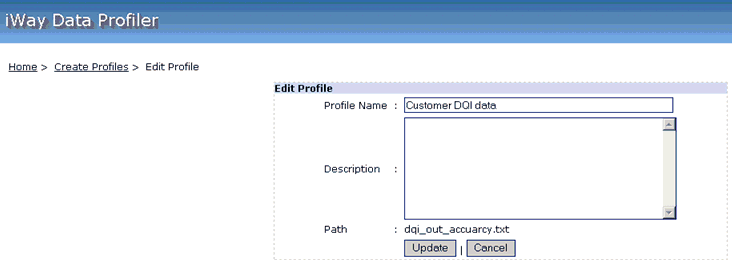
Edit the required fields and click Update to
save the changes.
x
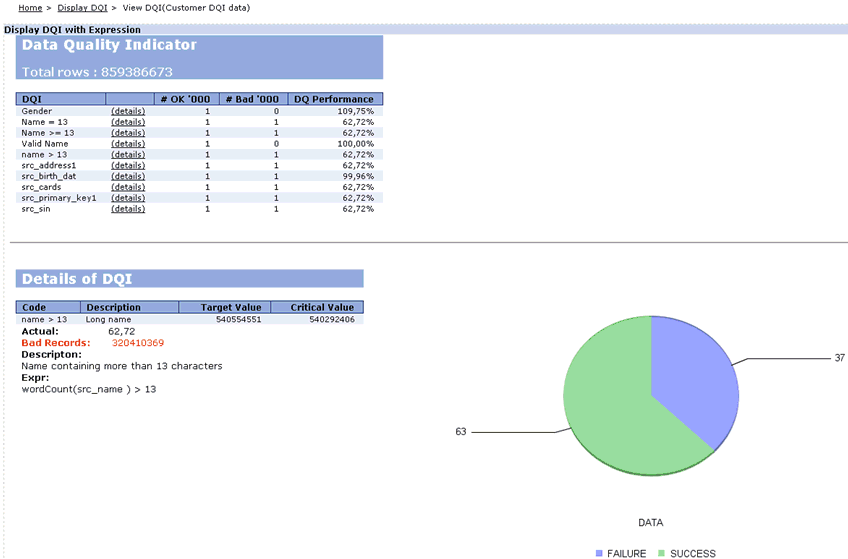
View Data Quality Indicators
Click the View icon in the Display
Data Quality Indicators page. The Display DQI with Expression screen
opens, as shown in the following image.
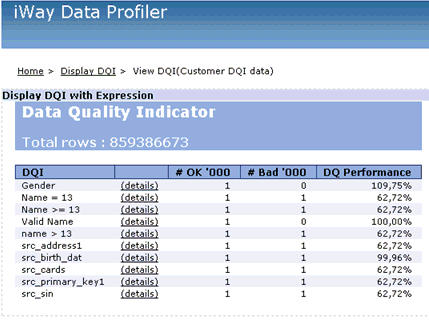
The DQI specifies the number of records which satisfy a condition
(good records) and the number of records that do not satisfy the
same condition (bad records).
Click the details link for a particular
condition to view a detailed report, as shown in the following image.
x
Click the Export DQI icon in
the Display Data Quality Indicators screen to generate an Active
PDF, as shown in the following image.
Note: The generated PDF is downloadable.