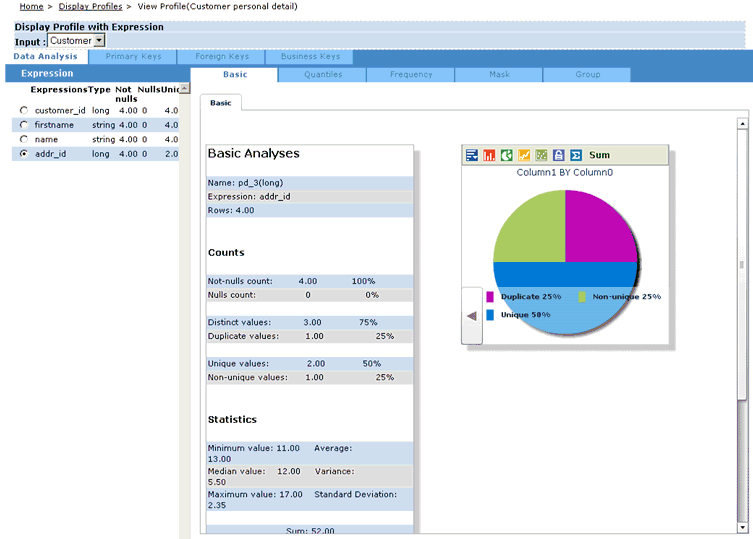
The Basic tab provides simple statistics about the data
that has been profiled and shows a chart of duplicate and distinct
data as a percentage of the whole.
This section displays the counts, statistics, and extremes of
the selected expression.
The Counts section includes:
- Not Null Count
- Null Count
- Distinct Values
- Duplicate Values
- Unique Values
- Non Unique Values
The Statistics section includes:
- Minimum Value
- Median Value
- Maximum Value
If the expression is a number, it includes:
- Average
- Variance
- Standard Deviation
- Sum
The Extremes section includes:
- Top five values
- Bottom five values
- Maximum Value
x
Procedure: How to View a Basic Analysis
-
Click the View icon
in the Display Data Profiles screen, as shown in the following image.

The Input field represents
the data table that has been analyzed.
The Expressions represent
the fields in the data table that have been selected as input from
the drop-down list.
-
Select one of the expression fields to analyze.
